26 June 2010

VPA V.1.2

VPA
VPA V.1.2 PDF Print E-mail
Written by karthik Marar
Thursday, 24 December 2009 18:53

Now an updated version of the the VPA AFL is now being released. The current release is VPA V.1.2


What is new in this version?

The new version has an exploration to scan for the various conditions at any point of time. You can also to automatic scan at fixed periods as per your trading Time Frame. So that it will be easy to identify stocks which bullish and stocks which are turning bearish. The scan works on any Time frame.

Here is a Snapshot of the exploration window.

Here is a Snapshot of the exploration window.

Note:

Please note the scan does not work on individual stocks. Works on on the whole market or watch list


Note:

Please note the scan does not work on individual stocks. Works on on the whole market or watch list
Last Updated on Thursday, 24 December 2009 19:12

VPA V.1.2

VPA
VPA V.1.2 PDF Print E-mail
Written by karthik Marar
Thursday, 24 December 2009 18:53

Now an updated version of the the VPA AFL is now being released. The current release is VPA V.1.2


What is new in this version?

The new version has an exploration to scan for the various conditions at any point of time. You can also to automatic scan at fixed periods as per your trading Time Frame. So that it will be easy to identify stocks which bullish and stocks which are turning bearish. The scan works on any Time frame.

Here is a Snapshot of the exploration window.

Note:

Please note the scan does not work on individual stocks. Works on on the whole market or watch list


Note:

Please note the scan does not work on individual stocks. Works on on the whole market or watch list
Last Updated on Thursday, 24 December 2009 19:12
Voulme Spread Analysis

Volume Analysis along with price and price spreads is becoming popular due to its simplicity and logic. This is more popularly called Volume Spread Analysis. This involves study of price action and volumes without any derivatives like Indicators. This study is a combination of candlestick analysis and volume analysis.

The basic premise behind the volume spread analysis is that the market is basically moved by the “Smart Money”. The smart money accumulates the stocks at low prices. Then begins a process of marking up the price. Then the “Dumb Money” starts entering the smart slowly. The smart money starts passing the ownership of the stocks to the dumb money. This process is called Distribution. Soon more and more dumb money starts rushing into the market not wanting to be left out of the big rally. Unfortunately the retail traders are the last to get in.

Once the process of distribution is complete the smart money starts rapidly marking down the prices and the dumb money are left holding the stock which was bought at high prices. At the end the smart money is much richer and they can again start accumulating the stock at lower prices. The cycle continues.

involves smart money and dumb money. The smart money will include market movers, Trader syndicates, brokers and institutions. The dumb money would include retail traders and newbie traders. The smart money also called strong hands accumulates stocks from weak hands. This process is called accumulation.

Here we are providing Volume Price Analysis based on our own Volume Price Analysis algorithm.

http://www.tatechnics.in/vpa/vpa-afl


The VPA afl

We are providing an Volume Spread Analysis AFL for the Amibroker platform. Following is a brief description of the functions in the VPA afl.

The VPA provides a price chart with VSA signals for the various bar. A top Title sections has an Information area. A commentary for each VSA signal is also provided. The commentary appears as and when the signal appears.

Information Area

The top Title Area provides the basic information about the Stock. It also provides information about the Volume, Spread and the close position of the current Bar. In addition it provides the information about the short term trend status, intermediate Trend Status and the Long term term trend status.

Price Chart with VSA Signals

The price chart provides the indication of the VSA signals for the various Bars. The signals include the standard signals like the upthrust bar, Pseudo upthrust bar, Stopping volume Test etc. i also includes derived signals like strength returning and confirmed weakness which are derived from the previous bars and background. When a signal appears the information area provides the description of the signal and the the at the same time the commentary section provides more details of the signals.

Commentary section

The commentary section provides a detailed commentary about the VSA signal

Note :

The latest released version also includes plotting of resistance / Support lines which are very essential to trade with VSA.


24 June 2010

Southwind afl

http://www.4shared.com/file/cpU1rgNF/Foundation-Int.html

23 June 2010

http://gurusarchive.blogspot.com/2008/11/highlight-phasemrtq13.html

http://gurusarchive.blogspot.com/2008/11/break-out-1mrtq13.html

http://gurusarchive.blogspot.com/2008/11/four-trading-styles-tutorialmrtq13.html

http://gurusarchive.blogspot.com/2008/11/reversal-trading-reversal-phase-1mrtq13.html

Topic 14: Highlight phase:mrtq13

Pls,see
https://blogger.googleusercontent.com/img/b/R29vZ2xl/AVvXsEjjg93EU0KQf7vp28e3gr3MfV3funH8XzjOYifmMd5YUhW-o7nGdJy1yJ3Avhp3c69NH5N2C4P5JLdX87crjfNPyK7uCwVhb6QA5AMEU85uBGBQyTWOSHljtVqZ5x8-5K3bPsVjn-A3nsw/s1600/highlightphase.png

the image below. I hope the image describes itself................I like to have some discussion on phase of a stock. Stocks go through phase. And we must understand in which phase the stock is in to enter in disciplined way.

You might see a strange thing in the image below.That is the stock below is moving in a calculative manner. If we research,we will see that there are several strategy that can be applied to this stock for entry.............

One could enter at first phase,which is recovery phase. Recovery phase is the most profitable phase of a stock. In this phase,the stock stops its fall and just move sideways.There will be flat base type pattern in this phase. The volume may not be heavy.Just some spike of volume can be seen here..............But the problem is we really don't feel like entering a stock at that phase. It is difficult to enter a stock when it is not moving up.But interestingly,big investors start to enter in this phase.This is their accumulation phase. Only big investors have strength to do that,as they have news in advance.They know that the stock is going to go up soon...........

Then,the stock starts to move up,which is the starting of second phase.Some small traders(especially the experienced,risk takers,informed ones) enter into beginning of the second phase when the stock has just started to move up.These are reversal traders.........Some enters into the middle of the move and just get out soon............These are momentum traders. Both of these groups are skilled traders. These are profit takers,and low in quantity in the market.

But problem occurs with the top,where new traders,inexperienced ones,uninformed ones start to enter. They are late. And they enter just at the top. Because already the stock is in fire,everybody talks about it.There is rumor in the market spread by other traders.So,all want to jump in it. The sentiment rises,and with that the price and volume rise heavily. Now getting a chance to have some lucrative profit,those investors and small traders that entered before everyone start to offload their holdings pushing the price down. This is euphoria or blow out phase. This is a bad entry.We should always try to avoid this phase...............

Then comes the pullback................Big traders already sold much of their holding to small traders at the euphoria phase.Now there is no manipulation by big traders.They are not holding the stock.The supply is high.Small traders hold on to their stock in lose.Some panic,and start to sell. Now if the selling is hard at this level,then the stock will go to reversal. But if the selling is not hard enough,or the stock is still in demand,the stock will go to pullback only..........This is another entry point............

Now there will be another entry point in the stock after the pullback.And technically that would be the last entry in this stock!!!!!! However,sometimes the stock may have several breakout and pullback. See Bracbank's one year trading..............

If you go through the data/charts of all stocks,you may find stocks usually go through such phases. And whether a stock will go to pullback or reversal situation,none can say unless there is indication of it.............

Now think why huge volume at the top is bad indication.................Because a lot of transaction is occuring. And usually,big traders are selling to the small traders there.............And usually,after tht euphoria phase,stocks lose momentum.............

Now why should we know where the stock is in at the moment! Because we need to be disciplined......................

Now how do we enter the stocks. We develop some criteria to enter the stock at each phase. We will work on each phase and find the best possible entry...............

Now if we have some pre defined entry strategy or patterns,we will have some advantage over the market. And one of them is discipline..............Because then,we will know what we will do under certain situations..................

Topic 13: BAD INDEX: mrtq13 (31-10-2008)

DSE/SEC ppl have started a very nasty down trend,and that down trend is still in existence...............It was a very bad step by them when they stepped in just to put market down couple of months ago............Such an immature step............God help the poor souls!

Now,see that they are begging traders/investors to buy back banks,as if we will buy whatever/whenever they want us to do that...........What a miserable situation. I have hardly ever heard that such responsible ppl like SEC/DSE authorities instruct traders/investors what to buy and when to buy............Clearly,the course of market trend has been changed by SEC/DSE itself. Now if the traders/investors don't buy bank,though they are at their lowest fundamentally,it is because traders/investors are in panic regarding index of 3000. This was created by those SEC/DSE monkeys!!!

So,they directly/indirectly are manipulating market and us-the traders/investors!!! We,the freak traders/investors,are always dancing with whatever they are wanting...................The freak show is set in a way as if they are in the "Mr. Know-it-all-headmaster" group,and we trader/investors are in the "dumb-fucking-assholes" group..............See the newpapers,media. Everyday everybody is shouting there that investors/traders are doing wrong(at whatever we are doing). Total chaos and confusion.................All of these are created by them............

Topic 12: HEIKIN ASHI: mrtq13

Heikin Ashi is an averaged candlestick chart. The high,low,open,close of normal candlestick is averaged in Heikin Ashi chart. But why! There is a problem with candlestick-the problem with feeling smoothed. Look at the chart of normal candlestick and Heikin Ashi charts. You will see whereas Trend,support,resistance are clear in Heikin Ashi,you will have hard time to understand those in normal candle charts..........
Besides Heikin Ashi has a trend showing feature,which normal candle doesn't.......I have one modified Heikin Ashi chart which changes its color when trend change.All you have to do is to enter when the color is green,and exit when the color is red. Easy.......Normal candle has small sentiment or trend showing capability.Not long.........Look at a candle chart,you will see a lot of red candles,which will tell you to get out of a trade early.But you will find that it was not an exit,as that stock later went up.So,you fell into whipsaws........
To get rid of this kind of whipsaws,Heikin ashi was created,and also has been created the Trailing Stop method......When combined,these two can keep you into a trade very very long time without getting you shaken out...........Remember to stay alive in the market,and to really get profit,you will have to hold on to a stock as long as it is in uptrend.............
I keep all type of charts in my soft. But I have different strategy for different situation in DSE. For example,I know that when there is compression pattern in Heikin Ashi chart,trend is going to change. This compression pattern was used to trade both Goldenson and 1stNRB and were profitable.........
However,you can't interpret the candles of Heikin Ashi as normal candles.There is hardly any evening star candlestick formation in Heikin Ashi candle.But we actually don't need that too......The more experienced you get on Candlestick technique,the more skill you will be to quickly understand what is going on........Anyway,for that you need to practise.And using Bar Replay,you can practise and learn...........

Topic 11: EXIT: mrtq13

WHEN TO EXIT ?................TA side for exit...........
But before that,let me say this........ Stock market,as you already know,is a matter of uncertainity. What we all try to do in the market is to keep the odds in our favor. And to do that,we implement different techniques-rumors,fa,ta,news,speculations etc.......
TA is one of the techniques that Traders use. It has good side,bad side. Like any other aspects of trading methods,TA is sometimes deceptive and unsuccessful in some aspects.Still TA has over everything else,as you can understand yourself now.Think how you used to trade in past,and how you see trades at present.........
There are several stages that you are going to go through,after you start your journey in TA world.......One of them is you would sometimes think,you have known all aspects of TA and now you are ready to profit. But later you will realise,your ideas are not enough. Again,you will see,you don't believe TA from the bottom of your heart.So,you don't trade depending on your trade decisions. Again,you will see oneday that you can't just trade without TA. You will lose everything without your chart.You will get addicted to it.You will realise traders around you are simply fools,because they are trading the wrong thing at wrong time.....
At a certain level,you will realise that you have to do things on your own.You will then develop your own strategy,though you may test and try to understand other traders's strategy.
Then,oneday you would realise,it is your mind that is disturbing you,that should be controlled,and disciplined............Well,you then become a real TA.........
Why I have written all those has a reason...........
-------------------------------------------------------
A good entry will surely give you a lot of comfort. But a good exit will give you a sure fire kind of profit. A planned,disciplined,and tested exit will save you from going to hell........And exit is as important as entry..........And actually,trading can be divided into three catagory from TA's point of view : 1. Entry. 2. Holding. 3. Exit.
------------------------------------------------------------------
Exit itecan be divided into several things. For example, 1. Stop loss. 2. Trailing Stop.
Now Stop loss is your initial exit level,if the trade doesn't work or fail.........Usually,experts recommend 7% to 8% of your invested money in a bought stock to be your stop loss. It means if you have bought a stock with 10,000 taka,you have to sell it at 9300 taka with 7% loss. I have found that 10% loss is a good percent for stop loss in bangladesh.....
I personally bet 10% on each trade. So,10,000 taka is my tolerant level for each 1,00,000 taka.
Now the question is why such a technique. The reason is simple. As you are a chartist,you know when to enter. So,let's say you entered five times into a stock. You lose 10% in three,but gain 30% in two. So,you are having 30% profit in total. This is an interesting trick.
-----------------------------------------------------------------
Now the trailing stop/exit part. Well,like I have always said,I use two trailing stops for taking profit. Surely,if you follow trailing stops,you sometimes will have to lose some profit. It is because,you have to give some chance to the stock to go up. So,you have to lose your trailing stops. Please,go back to a stock's chart. And see that if you use tight stops,you will get out of a stock very quickly.
You have to aim at big profit. Yeah,"YOU MUST TRAIN YOURSELF TO GAIN BIG PROFIT".
The trickiest part of trading is to hold and to take big profit. Sometimes there will be so sever pullback that you will panic.But selling in that panic will deprive you of big profit.......
---------------------------------------------------------------------
Now let's see a real example. I trade this in real. And I am going to write how I traded here........
Entry :
There was candlestick buy signal at first. See the yellow box on the candles. Then,there was a buy signal by the software. I entered the later day at 1483 taka. I went on buying on later days.
My stop loss was 10%.
And later days,I saw I didn't need that stop anymore. Because I was out of risk............
Exit:
Now I got concerned around 2306 taka,though I was "trying" to follow the long term trailing stop. Because market went gloomy at that time. And ABBANK was at resitance point. So,I sold more than half of my holdings following the short term trailing stop,which is blue here.............
Then,I rentered in ABBANK at 2370 taka,following another buy signal,volume and breakout. And again,I was following the sea green color,which is a long term traling stop line. However,AB again lost its strength around 3000 taka and started to create red candles.........So,I exited at around 2900 taka. This exit was based on not only trailing stop,but also on Candles,volume! I circled my exit in white box..............
But see next buy signal. I entered into it,but realised that it was a wrong entry.I tried to exit,but had a lose of 8%. I took the lose. And see AB's chart of later part.It feel nearly 30% more............
-----------------------------------------------------------------------------------
Now when do you take profit? The simple rule is going with the Trailing stops,trading with your own nature,and staying with the trend.........Trend is a very important factor. As long as trend is up,you should be very aggressive. But when the trend is downward,you must be watchful,cautious........
There is a very important thing that you have to discover. And that is nature. You would notice there are some traders that don't have difficulty holding a stock for long.But there are some that have real difficulty to hold a stock for long.They are comfortable holding stocks for short time...........
Find out your nature of holding...............
In short,let's summerise :
1. Don't base your profit taking completely based on candlestick.But be on alert when candlestick sell signal appears.2. Always be prepared to take some profit at resistance level. But don't think resistance level is the end of everything.3. Always be watchful at fibonacci levels.Because prices do change direction at fibo levels.4. Always stick to your trading plans,whatever happens..5. Always believe in Trailing stops,even if they look ridiculous,absurd and confusing.6. Always develop your own style of trading,and believe in it from the bottom of your heart.7. Always try to buy a stock at the bottom,not at the top(whatever happens),unless there is clear breakout with high volume.8. Give a stock time to give you profit.9. Be on alert when a stock gets oversold by indicators like Stochastic,RSI,MACD. But don't sell at oversold situation,unless you are too confirmed of reversal.Use Oscillators for enterting a stock most of the time.10.In the end,again,believe in trailing stops.They do work.11. Practise,practise and practise in past of stocks. Give yourself time to understand what is going on. Oneday you would realise you are becoming like a robot,machine in trading. And that is a good sign.

topic 10: PREMATURE SELL? SOLUTION IS HERE: mrtq13

This type of problem happens when :
1. you don't have defined rules which you have to follow in trading.2. you don't use "initial stop" to trade and stick to that initial stop.3. you get concerned about your position.4. you look at "normal candlesticks" too much and give them too much value.
Now here is the problem..................
1. One has to have all rules defined in a note..........What I personally do is that I record all my rules of certain situations/patterns in a video tutorial. I mean,say for example,I have come discovered a pattern to trade. What I do is to video in which I try to define the exit,entry,market condition,failure,initial stop,trailing stop,profit taking stops,and so on.........I run and watch the video in my leisure times,or whenever such patterns appear. That way,I feel confident to trade the pattern,as I know what may happen next.......I make the patterns a part of me like that so that I become natural to trade them...........etc...................Give this idea a thought. It does improve trade substantially..........You can easily memorize complex things with this idea...........I apply this idea of tutorial not only in trading,but also in other aspects of learning.............
2. we have serious confusion of stops.............The trailing stops you have shown in the chart are for "trailing" purposes only. They are not to be used for your initial stops. When you launch a trade,you need to have your own stop loss zone,which if violated,should tell you to exit the trade. And this should be defined by your total investment/equity. Or,your risk tolerant percent..............I can tolerate risk of 10% on each trade. So,I don't care if a trade goes down 10% from my buy price. But it violates 10% and reaches to 11%,I surely exit..........By 10%,I mean I can tolerate 10,000 loss on each 1 lach taka bet on a trade in one month. That won't hamper my total investment,my lifestyle,and above won't hurt my emotion.............
How one should determine one's initial exit depends on his own personality and livings,and also the stocks one is trading..................We need to have an elaborate discussion on this stop loss. Note that trailing stops are generally for profit locking! After a trade goes on your way,you should use trailing stops............
Also,you need to consider "position sizing",which is a very good and important idea to know...................
3. Did you ever find that you become emotional after you launch a trade................! And sometimes a lot of negative thoughts clutter your mind. Sometimes you feel you just don't know what to do..........You need to control your emotion.Pls,read ebooks on this matter..............You can do some kind of visualisation to give your mind positive suggestion.............But from my experience,I will say again,if you have defined rules and patterns,you will be able to trade with confidence and avoid negative thoughts of mind...............
4. You must use Heikin Ashi............I surely don't,again "don't",support to trade only by candlesticks. They are very very deceiptive. Use normal candlestick only for interpret the days movement or for the movement of a particular patterns. Pls,go through what I have written about ICBislamic's trade in this forum( viewtopic.php?f=6&t=13 ). I surely used normal candlestick to interpret the movement of that stock.But above all,I knew that there is a pattern(upmove and consolidation) in which all the buying candles are appearing. I actually emphasised the pattern more than the candles. Surely,candles are good. But they show short term move. For a longer term move,you need to see the pattern,where the stock is now...........The critical problem with candlestick is they will bluff you unless you haven't practise them hour after hour. You see a red candle,and you become concerned. Though that candle has not much meaning..........But the problem arises because you become concerned and you start to get emotional. Negative thoughts come into your mind............Pls,note the difference of stocks and trading between bangladesh and other countries...............
I can easily trade by normal candlesticks in U.S market. But they become very much confusing in our market. Because our market is very much volatile............U.S market follows logic and calculation heavily. By the way,forget Warren Buffet. It is very much silly,imprudent,and childish to follow a huge investor like him. He alone can crash/shake part of U.S market(not whole). Small traders like you and me can't and should not follow him. This is unrealistic and unmatched thing! He is institutional investor...................
BD market is all about trend and smoothing out trend. Note that there is a critical difference between other market and ours. And that is timing. We have to wait two days after our buying to sell. But in other countries,you can buy sell anytime. So,one should have different style to trade our market. I have learned this truth the hard way...............I must add one last note : give value to support and resistance in our market. Because they work.......

Topic 9: candlesticks, system trading: mrtq13

1. You will always need Candlestick..........But the question is to what extent you will use Candlestick in your trading decision...........That you will have to decide on your own...........
Personally,I don't give too much emphasis on Candlestick now a days.As a beginner,I used to give emphasis on Candles,because I thought and read they work like a charm.They do,but not as charmfully as we think in DSE. As I got more and more involved in TA,I found there are several different things that are superior to chandlestick.......... I only look at candlestick just to know how the day was-bearish,bullish,neutral or what........That is it..........! My trading decision is not dependent on candles mostly...........
2. Besides knowing about normal candlestick,you need to know about Heikin Ashi. It is the most important one for DSE,as DSE is a volatile stock exchange. Traders sentiment is inconsistent here..........So,normal candlestick would confuse you,you need something that smooths out the whipsaws here.............
3. Use only one oscillator. Using more than one oscillator for the same purpose is technically wrong..........Macd is a bit slow. Besides,you can see the crossover of Macd(to an extent)in your candlestick chart with Moving Average............I prefer Stochastic. And STochRSI is better than Stochastic..........The choice is urs.........
4. You need to learn about Volume and how volume influence price action...........It is very important...........
5. Moving Average is important. They represent past price action and future price too! So,one should give emphasis on them..........
6. You should work on Buy,Hold,and Sell together..........We emphasis on Buy too much,whereas Hold and Sell are also important.............Especially,exit is more important than entry..............
7. You need to know about Pullback, Breakout,Reversal,and Rangebound trading style. And you need to find out which one is suitable for you to trade!
8. You need to find out a guide who will show you the way to TA. That way,your life will get easier in TA's world.It is a huge area,you will surely get lost in this world.........However,there is no guide around. So,you will have to do things on your own. So,keep going.........
--------------------- ** ---------------------
Now System Trading...........!
Let's make it simple..................! However,I don't know how to define it in simple term........
Well,let's see some rules..........
Rule 1 : Experienced traders here might have seen that when a price moves up,say for example 6%,from previous day,probability is it will rise further............
Rule 2: Again,some experienced traders here might also have noticed that when a stock has high volume with rising price movement,probability is it will rise further.
Rule 3: TAs here might have noticed that when MACD crosses the zero line,probability is the stock will rise further.
Rule 4: TAs here might have noticed that when short term moving averages crosses mid term moving averages,probability is the stock will rise further.................
Now,we have got four trading rules. We know when these rule appear in a stock,the stock usually rises...........We memorise those rules. See them in charts. We are happy...........Because we promise ourselves that whenever they will appear,we will enter into the stock........
Unfortunately,many times we can't...........Because we are driven by Brain. And Brain has limitation in processing data...........That is why,computer can defeat us in chess game..............
So,as computer can process data well and can give us the most perfect output,so let's use computer to process the data for us to trade...........
Now let's feed our trading software with the above four rules. And let's program it in such a way that whenever those four rules appear computer will tell us to buy...........
Now all we have to do is to buy after the computer tells us to buy..........
That is it..............
By system trader I mean,I program the software and give it the rules of my trading style. It then start to give me Buy/Sell/Hold signal. And I go by those signals............
This way,I don't have to think and get confused.............
Brain is a weak machine when it comes to data processing,computer isn't............
Below is an example of a trading system I am recently with...........I hope it will give you an idea of Trading System...........
-------------------**------------------ _________________1. Cut your losses short........... 2. Take your decisions on your own.... 3. Future can't be predicted.So,don't fight the market! 4. When in doubt,don't trade......... 5. Be aggressive with Bulls,be defensive with bears...

Topic 8: STOCK MARKET CRASH: mrtq13

"REASONS FOR STOCK MARKET CRASH
There are many reasons that have been responsible for the crash of stock markets across the world. First reason is ?huge frauds?. There are many types of frauds that are associated with the stock market. Normally, the stock market does not crash on incidence of minor frauds. But if huge frauds are unearthed, the stock market normally responds to this by crashing down. It is to be noted here that stock market crashes because of heaving selling. When all the stockholders, whether individual or institutional, start selling their holdings, the stock market index comes down heavily and it is said that the stock market has crashed. In the past, many stock market indexes had crashed due to these scams. One of very famous scams is the Harshad Mehta scam that is associated with the Bombay Stock Exchange, when the Bombay Stock Exchange Sensex, also called BSE Sensex, came down heavily and the stock market crashed within few minutes.
The other reason that can be citied for the stock market crash is toppling of government. If due to any reason, the government of the nation is toppled, the stock market is one of the most immediate markets that react to the event. It comes down heavily and in most of the cases, it gets crashed. There are many reasons for the toppling over of government and stock market responds to these reasons quite sharply. One of the reasons that are responsible for the stock market crash is the announcement of budget for the next financial year. Normally, the budget is announced by the central government for the succeeding year and along with budget, the economic policies of government regarding the development of industry etc are also announced. If it is felt that the policies announced in the budget are not conducive to industrial development, stock market reacts quite heavily to this and gets crashed sometimes. As we all know, there are many foreign companies that make investments in the stocks of companies listed at the stock exchange. When these foreign institutional investors go for heavy shelling, the stock market crashes. The foreign institutional investors, also called as FII in the stock market, go for heaving selling due to number of reasons. It can be political instability in the country where the investments have been made or finding of green pastures elsewhere. Whatever is the reason, if FII go for heavy selling, it is seen that the stock market index closes 3-5% lower than the previous day closing and it is said that the stock market has crashed.
Another reason when the stock market reacts shapely is the death of any prominent political leader. The decline, however, is temporary in most of the cases.
Apart from the above, there are some more reasons that are responsible for the declining of stock market. These are crashing down of contemporary stock markets, big corporate and business houses announcing their loosing annual or monthly numbers etc. Thus, there are many reasons that are responsible for the crashing down of stock market. Whatever is the reason, it can be said that as the stock market crashes, the prices of stocks of listed companied come down sharply. Let us now discuss some of the aspects related to stock market crash.
RELATED ASPECTS OF STOCK MARKET CRASH
There are many aspects related to stock market crash that need to be understood. First of all, as the prices of stocks come down during stock market crash, it provides good opportunities for various investors to make investment in the coming days. However, a person has to be vigilant because it has been seen in many circumstances that the once a stock market crashes, it take many trading sessions to follow an up-trend. For a small stock market crash, the word ?correction? is often used. But in such cases, the stock market comes down due sharp rise that has been observed in the past few days and there are no fundamental or technical reasons for that. Sometimes, the stock market crash is so sharp and deep that the regulatory authorities may take decision to stop trading so that no further drop is observed. This cessation in trading can be few minutes, hours etc and the decision is taken only after conforming the sentiments in the stock market. Before a person goes for buying of stocks after the stock market crash, he must confirm that the stock market is really showing signs of recovery. This is because if the rise in the stock index is temporary, the stock market index can close at even lower levels as compared to the previous day close. Thus, there are many aspects that need to be understood regarding stock market crash.
THUS, STOCK MARKET CAN CRASH FOR MANY REASONS
After reading the above article, the stock market can crash due to many reasons as cited above. Whatever is the reason, it is certain that the price of stock listed at the stock exchange would definitely come down. There are also some aspects related to stock market crash that need to be understood completely before a person goes for making investments."

topic 7: STOP-LOSS (part 3): mrtq13

MORE ON STOP-LOSS:
Now-the stoploss stratyegy-well,that is another skill that
one needs to acquire!!!
For example,it was reasonable to put 10% or more
stoploss in a stock like NCC.................Why????
because of its price level and future.............It was at its
low considering FA and TA. And how low can it go
more.......? So,in such situations putting 10% or even
15% makes sense............It gave whipsaws. And that
happens........
In TA's term,this is called "ReTest of Bottom". What
happens is,before going up strongly,many times a stock
goes below from its normal trading range. This way
weak buyers get shaken out.Thus,it creates whipsaws.
This is a very strong signal for upward
move...............See the Retest of bottom Atlas
below..........How do you know that it is a
retest............??? Actually,you never know...........
But what we can do is to setup the stoploss in such a
way that it will keep us alive,or we won't get stopped
out..........And again,this stoploss has to do all with price
level and stock's Fundamental condition in many
ways............
If we put lose stoploss for Banks,it will make sense. But
if we put lose stops for Insurance or mutual funds like
Aims and Grameen at the moment,well,then we can
expect some bad experience..........

Topic 6:STOP LOSS (part 2):mrtq13

This is a very elaborate topic,and needs extensive discussions.............There are several things we need to focus while discussing this whole issue........Say for example :1. How is the market condition now.......2. Are you at the top of market-we are at the top of the market............Aren't we??? Did anyone notice this? DSE isn't expending upward,right???3. How do you feel about large fall or short fall........?4. Your risk tolerance level..........Do you have another sources of earning money and can take too much risk?5. Your total capital...............6. Your trading system. Is it set for short term swings or long term trades..........7. Your experience............--------------------------Let's discuss the above in a very short manner..........DSE isn't in good condition. Too much inconsistency is there. Any trader should remain cautious in such situation...........So,your stops should be tight......Right......? I have seen that in the last fall recently,many became freezed and started to think if they will hold on to their stocks or sell..........There is nothing to think......The market is falling....And that is a fact! Accept the fact and act accordingly........We are at the top of DSE's history. And this is the riskiest zone! Believe it.Don't be too brave at this level!! Whatever your big brothers/so called gambler brothers say,only care about your money and be scared!! Think about it. Let's say,you have invested ur whole amount in the market. Tomorrow market has fallen 90 points like it did recently..........Then,market stops. You feel good,though ur total lose is 4% at the moment! Market stops some times,but crashes upto 300 points. Your lose reaches 15%. Now what are you gonna do? You would become freezed! You wouldn't be able to sell,because the lose is huge. The market doesn't stop.And you lose more and more everyday.Think about the Jamuna oil's holders. Everyday they lose. For last couple of months,they have been having pain............What was the point of such holding............Some are down 40%!!! Wow,what if they took 7% lose and got out this loser stock initially............???The same applies to the whole market.........Now bravity can be shown when you are at the low of the market. If you showed bravity last year,you would gain hell lotta profit..........Because the market was at its low,and going upwards...........Now we are at the top...........So,a lot of correction is expected. But alas,market never goes straight up,or down. It comes down goes up,comes down and down.............What are you gonna do!!!!Try to understand that market's situation changes,and with the changing scenario we should change our strategy...................How much you can bear in a single trade............? Did you ever give it a thought..........?I think I can take 7% lose in every trade and total 3% lose in my total equity on each month..........But what about you...........What kind of trader are you..........? Are you a very short term trader. In that case,you should not bet more than 6% lose or even 5% lose............But if you are buy and hold type of trader............You can bet 30% and even 40% lose sometimes..........But the question is where the hell you have entered the stock........If you have entered at the low of a fundamentally good stock,then taking 40% lose makes sense..........But if you have entered at the top of a fundamentally weak company,taking 40% lose or betting 40% doesn't make sense,does it.........How about your trading system...........How did you set it............I have seen all of our trading systems are for very short term trade............So,our exists should be no more than 6%..............How much experienced are you...........How much you are pshychologically capable of handling a drawdown situation............Now this seems to be the most important point..............When I begin trading with system or TA,I had hard time trading. Sometimes I used to lose my faith in it,because it just didn't give what I expected.........Year ago I bought Intech Online. I put 6% stoploss in it. After I bought,I saw it falling. And even though It didn't go below 6% lose,I sold it. Because I didn't believe that it will work,my system would work.........I got scared,and very indisciplined. After I got out,I saw Intech rocked. I got fucked up,and frustrated................I had more than 4 losing in a raw in a month sometimes. I got frustrated. I thought I may not be able to recover those loses. I felt like kicking the Trading Systems and TA. But later,I saw I not only recovered my loses,rather I was up more than the lose with the same system and strategy.Why do those happen............? Think about it.........There are several factors that work here......Lack of plan is the most crucial,and controlling mind is another important thing.........Anyone telling you that he had never a losing trade is great lier! So,except the fact that lose is a part of our trading. If we can accept it,we will be able to overcome it...........Fear matters! Did you practise your trading style and strategy in real life trading.....That is a very important thing.....Sometimes it is wise to take loses for the shake of practise only. Believe me it works.Trading seems to be a matter of experience too.Oneday will come when looking at a chart you will be able to feel what may happen and act accordingly............Whatever happens,preserve main capital..................When we are at the top of the market,long term hold strategy doesn't make sense,does it..........We never know about future. So,what's the the point of thinking about it.........We should go by strategy,and change our strategy when the market changes.........DSE has changed.......So,it is better to change our old strategy,and be quick to take profit and cut loses...

Topic5:STOP LOSS (part 1) :mrtq13

Depending on your trading style this percentage should be set. For example,if you are a long term trader, you could tolerate 15% fall of price from your buy point. Because you are holding it for a long term. And on your way,the price could fall 15%.........Or,if the stock is good enough,you can tolerate 20% fall of price from your buying price………..So,it is up to you……….If you are a short term trader or your investment capital is low,you could tolerate not more 6% fall from your buy price…….
What if you exit after 7% lose and then the stock starts to rise….  You re-enter…..You have nothing to do… And it could be that after you re-enter,the stock could start to fall again…….

Topic 4:BUY AFTER RECORD DATE: mrtq13

The first method :
1. Buy after the book closure of a share that declares bonus,especially banks. Ok,this setup is one of my favourite. And this has been hugely profitable for me and my friends. You will see that when a bank declares 30% bonus,after book closure its price falls 30%. So,we have an undervalued share after book closure. And undervalued shares(if everything is fine with it) is always an attractive buy for traders. Traders jump into it.All you have to do is to jump before all.This is an anti-trend trading approach.........
This approach combining with technical analysis can give you great profit each year in bank sectors...I bought NBL,Uttara,Pubali,Prime bank,Southeast bank,Dhaka Bank,City Bank,Atlas,Usmania,Heidelberg following this technique just after their book closure. All were profitable.Some are 100% profitable.Recently,I bought Jamuana,Abbank and Islamibank because of this setup after their book closure. All were profitable. I am keeping an eye on Standard bank too. But it looks like it will take some more time to ripe :)
Now how reliable this technique is!!! too reliable...I have studied five years of data of all banks and applied this method. It worked each year. Only once this method failed.And it was in Dhaka Bank's case.May be,the bank was in low profit then.....
Your invested capital will get returned within 5 to 6 months with profit by this method.
I combine technical analysis(charts and indicators) with this method; So,I can understand the best possible entry time. You might have difficulty in entering at right time........
The second method:
2. The second method is a well known method. This method is buying before a company's bonus/dividend declaration time.........This one is not as reliable as previous one. But if you can calculate things well,you may be able to profit.....But this is a more complex situation....
As you can see Napolymar,Aftab,Pran,Keyacosmetics,Keydetergent are rising now..Why?Because their declaration is near.You might see a rise in DESCO too.Because its declaration is nearing too.........
I found that big traders mostly know beforehand what the company is going to declare. So,when they buy,try to buy with them.......
I have nothing much to say about this setup...This one works,but not as effectively as the first one........
I have some other setups for entry :
1. I would buy a share when it goes up a certain percentage from previous days close. For example,if tomorrow Jamuana's opening starts to trade 3% higher than today with pretty good volume,I would take a notice of it. Such a move means Jamuana is in Trend. And I like to go with trend.
2. I wouldn't like to buy a share if it hasn't gone through a pullback. I like to buy on pullback.
3. I like to buy breakout. It means when a stock starts to trade above a certain price range,I would buy...........
4. I also feel good buying at support level.
There are other setups. Depending on your trading styles,you should determine your entry and exit setups...........And you will see that when you have your own defined setups,you will have less loss than before.........

Topic 3:about amibroker: mrtq13

Amibroker is one of the best trading softwares in the world.... You will hear the names of Tradestation or Metastock in trading areas by the experts....But be assured,those softwares are now a matter of past-the gone ones. Amibroker is the "future" of Trading softwares.......
The idea of using technical analysis with trading softwares in our country is quite alien... But I have seen that DSE Management uses RSI,Moving Averages etc in their analysis of market...So,I assume they are aware of trading softwares.May be,some others know about trading softwares too.But in a country like ours,knowledge is always kept hidden....
Before proceeding with trading softs,keep in mind that there are a lot of problems with trading softwares in our country. The fist one and the most critical one is that you cannot download daily price data from DSE like you can download data of Nasdaq or Bombay Stock Exchange from Yahoo for "Free".You will have to enter the data manually from DSE's funny "Website",which is a time consuming and energy racking thing... Well,guess what...!!! Unfortunately,you are in a country with the lowest knowledge on technology. Those freaks/monkeys in DSE didn't yet develop a simple technology to provide the traders with daily data in Standard Format. DSE always talks about so called transparency,analysis etc,whereas they don't themselves provide the traders with a way to see things accurately,transparently,realistically......
Chart in trading is used worldwide. The reason is simple. Looking at a chart you will know where you are standing,where the stock is going... Trading without chart is like walking like a blind man.You don't have any idea of what's going on. Surely,chart is no magic.But It is a helpful tool in trading.You can trade without trading softwares. Even in New York Stock Exchange,they used to trade without Trading Softwares around 1920.However,technology was not so improved back then......I have read that even the world's richest stock investor Warren Buffet(who is apparantly a fundamentalist)uses charts too.....!!!!!
Anyway,Amibroker can't be found anywhere in BD,I guess. It is not available in underground world of pirates in Net too. Recently,they have taken it away.Metastock and Tradestation can be found......
Fibotrader is also the best among the free trading softwares. In fact,there are not many free trading softwares in Net like Fibotrader and FC chart. You will get all trading tools and indicators in Fibotrader that can be found in Amibroker....From RSI to ADX,you get everything. You can also program your trading system/rules in the software.......
I have actually come to know about Fibotrader after I have known about Amibroker. And I am involved so much with Amibroker that I don't have time and energy to change my tool now from Ami to Fibo.However,Fibotrader has its own built in trading system that is based on retracement of Fibonacci Ratios.........
You should consider the pros and cons of using Trading software in your trading. The problem is once you start to use Trading software,you can't just go back to your old style of trading....So,think if you really want to change your trading style. If your current style is profitable,there is no reason to change it..........

topic 2: EXIT: risk management : mrtq13

You have asked the most important questions that a trader could ask…. At the beginning of his trading life,the first question a trader usually asks is “when do I buy a stock?” After some trades this very trader will desperately ask, ”when do I exit when I am in loss or profit”. Why? It is because he finds out after entering a stock he loses his way, he knows nothing of when to exit and nobody else also seems to know that. He finds that exit is more difficult than entry. Any fool can enter into a stock. But it takes a lot of calculations or planning for exit. Let’s discuss some topics here(this one is basically written for beginners or those who are confused about exit/pullback etc.Experience trader may add their view)…….
Exit :
Depending on your trading style, you should develop a plan of your own on how you want to exit from a trade. There are short term trader,there are long term trader,there are mid term trader. Each has his own style of Exit point.
A trader I know exits a trade after entering into it ,be it a winning one or a losing one,just after 4 days of his buying…. That may sound strange. But it is his style. His style is “Time based exit”.
There are two different Exit plans needed for trading. One plan is for just after entering a stock/buying a stock. Another for the stock that is in profit. The first one is called “stop loss” or “initial stop”. The second one is called “trailing stop”….
Stop loss point :
You enter into a stock and it starts to fall. What are you going to do? You have two options- either you keep it on hold hoping that someday it will come to your buy price. Or,you get out of it taking some losses. The choice is yours.
But statistically it is found that it is better to exit a losing share taking a little loss. Think about what happened to Rupali Bank. There has been more than 50% retracement in this share. Those who bought at the top lost 50% money. If they exited early taking small lose like 10%,they could save 40% of their invested capital. And the problem is they have to wait for the share to come to their buy price for several months. Which itself is another loss. Because you cann’t invest in other stocks. Your money is stuck into a losing share…………So, if you're stubborn and stick with your falling stock, things could get ugly. You believe the stock will turn around, only it doesn't. Instead, it drops 15%, then 30%, then 50%.
Ok, now a simple technique that can be used is percentage stop. The idea is a trader should get out of a stock that has fallen 7% to 8% below his buying price. For example,you buy a stock with 100 taka. And it goes below 93 taka(closing price). You should sell it. Because there has been 7% fall from your buy price.
Why is this measurement!!! The reason is simple. Think about it…Why should a stock go below 8% of your buying price if you have bought it at the right situation. It means that the stock’s price is falling.Or,you have bought the stock at wrong time…….. Now is it in correction or pullback? You don’t know. If it is in correction,you are in trouble. If it is in pullback,then it should not go below 8%. Because that would be too much fall……..Why is it falling?
Now is 7% or 8% magic number!!! No,they are not. They are just a technique/rule to make you a disciplined trader.-a trader that knows what to DO. A fighter that doesn’t know what to do under fire dies fast…..
Depending on your trading style this percentage should be set. For example,if you are a long term trader, you could tolerate 15% fall of price from your buy point. Because you are holding it for a long term. And on your way,the price could fall 15%.........Or,if the stock is good enough,you can tolerate 20% fall of price from your buying price………..So,it is up to you……….If you are a short term trader or your investment capital is low,you could tolerate not more 6% fall from your buy price…….
What if you exit after 7% lose and then the stock starts to rise….  You re-enter…..You have nothing to do… And it could be that after you re-enter,the stock could start to fall again…….
Trailing stop :
Trailing stop is another kind of stop which is also based on percentage measurement. It is used for profit taking.………..When do you take profit if you are in profit and the stock has started to fall from the top price……One simple method is to take profit selling the stock when it falls 10% from the top price…….For example,you have bought a stock with 100 taka. And it went to 120 taka without any trouble. And after it reached 120 taka, it then started to fall. You have to take profit.When are you going to take it…. You take your profit by selling the stock at around 108 if your planned trailing stop is 10%..............
Note that the higher a stock goes from your buying point,the tighter the trailing stop should be. For example,your initial trailing stop for the 100 taka’s stock above was 10%. You planned to sell the stock if it goes below 109 taka from 120. Now what do you do if it goes up more than 120 taka,say for example,what if it goes to 150 from 120 taka. You tighten your percentage from 10% to 6% depending your style. So,now if it falls below 141 taka,you get out taking profit………..So,it can be said like this : your price goes from 120 to 130 to 140 to 150. You set your percentage from 10% to 7% to 6% to 5% etc. The higher the price goes,the tighter the trailing stop gets
You have to adjust your trailing stop on periodic basis……
And remember that you can’t sell a stock just at the top level…You have to sacrifice some profit.According to Dr. Van Tharp,a great trader in U.S stock, “the ironic part of trading is if you want to maximize your profit,you must be willing to give back a great deal of the profits you have already accumulated……….”
There are several other techniques that can be used as exit point. For example,support level,Resistance level,Moving average points, Average true range,etc…... But they are bit complex and you may need Softwares to measure them. One of the famous exit technique is Average True Range,which I personally use……...
It is nice if something automatically calculates the exit points for you. You then can be stress free and your time will be saved. A trading software can do it for you and show you the way to exit visually. That’s a great thing. Because computer is always stronger than human brain in the matter of calculation………..
You can use Excel for calculation of percentage,too…………..
Here are what I told myself before I developed my own style :
Have your own plan. Take the best techniques from other traders. Refine and modify them to suite your personality. Write them on paper and periodically polish and update them from your experience……..Manage your risk,manage your exit……….
Remember what Zen says :
The ultimate Zen trading question: How do I know I'm right? Zen answer: There is no right and no wrong. You manage risk. Do that well, and you're right.

22 June 2010

TA learnig Short List : mrtq13

Narrow down your study to the following :

1. Candlesticks.
2. Trends
3. Trendlines.
4. Chart patterns.
5. Fibonnaci ratios.
6. Pullback
7. Breakouts.
8. Moving Averges.
9. Bolliger bands.
10. Stochastics.
11. Volume.
12.Stop losses.
13.Trailing stops etc...........

That way you will learn more with little efforts. It is a waste of time to put your energy on RSI,Stochastic,MACD at the same time. Becauese these are same in the sense that they are oscillators. So,learn one of them,you will understand all..............
I don't know why you are studying Amibroker's help file. I think you should take the help of google. Choose a topic and search articles on it. There are plenty of good articles in google. Save them in your pc or print them out. Read them,and study,and research...............

05 June 2010

HOW TO READ A CHART ?

How to read stock charts
Reading charts is an art that can take years to fully master. Why do we read charts? Because, by reading charts, we can determine what the SMART MONEY (SM) is doing!
You have to be able to analyze a chart and come to a conclusion about whether or not to risk your hard earned money on a trade.

That is the real objective of chart reading.

And this is what separates the novice trader from the professional. There are several factors on a chart that make it worthy of trading. By analyzing these factors, we can determine with high/moderate probability which direction a stock will move.

When you look at a chart, you may to ask yourself some questions like:

What stage is this stock in?
Is this stock in and uptrend or a downtrend?
Is the stock at the beginning, middle, or end of the trend?
How strong is the trend?
Where are the trend lines?
What wave is this stock in?
What do the moving averages tell me?
Are there any chart patterns?
Zoom in (real  dimensions: 1366 x 741)chart reading.png
chart reading.png (18.35 KiB) Viewed 510 times

Are there wide range candles in the direction of the trend?
Are professionals selling or buying?
Where are the support and resistance line/areas?
Is this stock at a Fibonacci level?
What does volume tell me?

I know it seems like a lot of information to try and keep track of but all of the above questions are essential to chart reading.

Ok, now let's go through the list one by one to make sure that you know how to answer the questions correctly. Don't worry, with practice, you will not even need to think about these things. It will become automatic.

You will be able to read charts with lightning fast speed. In just a couple of seconds you will be able to glance at a chart and know all the answers to the questions above.

We don't have to be scientists to read charts. You only need to have a pair of trained eye to visualize the behind the monitor activities.

And how do you train your eyes ?

Nothing is free in this world. Like any other things in your life, it will cost you something. To be a good chart reader, - to have a trained eye - you need to devote and concentrate more - - - - by looking at and observing the charts.

When you look at the simple few symbols of the chart- you will have also have to visualize the drama behind the curtain. It is easier than the conventional afls or complicated diagrams, if you can visualize.

It is faster, easier and philosophically far more confidence creating - if you can read the chart. Not too many symbols you will be needing to deal with. These symbol hint many back door actions. You are a SIGN READER !

As a SIGN READER, when you will see the image of a day, you will visialize like a celluloid. When you look at the past images in the various time frames ( strating from day chart to perhaps three year chart ... just few snap shots..... like a bangla movie goer :roll: , you will also be able to tell what is gonna happen next.

Trained eye can read that !

In BD it is easier because the variables are less here.

But before everything, we must know the basic rules od price actions. We must have the basic wall papers imbedded in our mind about why price varies. What are the conditions for which money moves. Interested members may Google through; some might be shocked to see that 80 % of world money is being moved by 6 families of the world ? How these families are controlling USA ? We will not discuss those, but an educated traders should know that certain conditions are required to be fulfilled for money to be moved. Remember that, money is something - that is hard earned. It is a serious business.

As stock market is faster and associated with risk, with very high dividends - anyone / company / enterprise with high liquidity get involved with stock exchanges, all over the world. On the other side are the retailers with shallow idea about what is happening behind the screen. They just try to reap benefit from the big deals - deals unknown to them. Most of the times, they get caught during the 2nd or 3rd day of the Euphoria stage. Statistically it can be shown that in stock game, the number of losers are above five times than the rest 20 %. In longer time frame, the figure comes down as low as 10 %.

So a common psychology always works on the retailers that " porer bar deikhaa nimmuu" kinda. Most misses the train. Some looks away from a stock, kokhono obhimaan kore, kokhono ghrina kore. So there are bulls and bears. A chart reader therefore needs to see what they are ACTUALLY doing. And what our SM planning to do.

A simple candle tells us about so many possibilities. Let us take one arbitrary chart. I am uploading it now. We will look at a candle.

Lets have a look at the lowest candle, that is in red.
t1.png
In it self, its a candle with only one tail or shadow. We will come back to the candle tail matter, later. The poor red candle looks like the lowest one in the year. It had suffered a great fall. But that was the day, the cleverest ones brought at the cheapest rate.

But what if this candle is not so prominent in bigger time frame. Have a look at the weekly chart.
t-2.png
does it look scary ? Think yourself standing on the last green brick. So this company is maintaining a (loose) range roundness.

So, if you are at the green brick, will you be a bull, or a bear ?


Look at the charts again. Notice the difference and similarities between the top ones, that is the Bollinger Band movement and the squeeze.
Zoom in (real  dimensions: 1366 x 741)small banks 3 may.png
small banks 3 may.png (37.67 KiB) Viewed 444 times
Zoom in (real  dimensions: 1366 x 741)big banks 3 may.png
big banks 3 may.png (37.76 KiB) Viewed 448 times
Don't you think, that the squeeze percentage is more for the Big Banks ? Notice that during the first week of April, the squeeze was tightened. What does that mean ? It means that from the begining of April, the daily close price of the big banks came closer and closer towards the average closing price of last 20 days. That signifies that the volatility had reduced in comparision to the mean volatility. Tarmane holou, abnormality. Je bachhata .. parle sarata bikel khelto, she ekhon math'er pashe dariyei khela dekhte beshi like kore. This is not normal for that child.

Child er ashukh hote pare .. ba koto kisui hote pare .. but a stock is powerful entity, that vibrates always. Price is something, that can not remain static. The various factors always ignites it, so that it changes its value. And therefore, the natural tendency of a stock is to move towards its mean level of volatility. A seasoned chart reader therefore would also look for the historical volatility level for that particular stock. That will give a rough idea about how much squeeze it may play on the stock. But it does not mean that a stock must have to attain that level to have a break out. Many stocks will breakout before that level. Therefore, with only BB, you really can't feel when the actual breakout is going to occur. The squeeze only gives out a strong signal that a period of increased volatity ( not price rise - it may go down too, or may start flauctating betwenn two levels instead of climbing up only) is ahead. So the long term investors start investing.

A chart reader is not so helpless. He selects some low priced OVERSOLD (http://www.sharemarketbasics.com/Terms/Oversold.php), check their BB squeeze. He sort out the bests in term of Squeeze as well as the OVERSOLD condition.

Now he may like to use, the most abundantly available information as his tool. One is the price and the other is the volume.
Zoom in (real  dimensions: 1366 x 741)big banks 3 may.png
big banks 3 may.png (37.76 KiB) Viewed 448 times


Indivual stock's behaviour is little different than a whole sector, so we will switch over to any arbitrary stock for learning purpoeses. We will try to see how does the chartist use his tools to find out the nearness of a breakout ?
But, still as a point of interest, let us have a last look at the big bank's chart for the last time. Just notice that, during 1,2,3, and 4 gradually lower volume support was required to push it back inside the band. That is indicative of requirement of lower force requirement. Immediately after the fourth push back, the volume started increasing, you will notice bigger diffrence in the opening and closing prices.
Zoom in (real  dimensions: 1366 x 741)vola bog banks.png
vola bog banks.png (65.48 KiB) Viewed 442 times
The BB should have been started spreading, but it didn't. It did not because it counts the mean from 20 days back. Even ffter passing about 50 % of Bollinger time period, the BB remained static, but the price crossed the band and eventually, (5), you see that a red hand pushed it downwards. The next day, taht was on 3rd May, it played with higher volume, but remained inside the band. However, notice the moderate price gap between the last two days. So these varitaions (flactuations), will add up and effect in the spread of the BB.

Tomorrow, we will see an Individual stock and see, how Bollinger Band is viewed from the Volume price actions.

03 June 2010

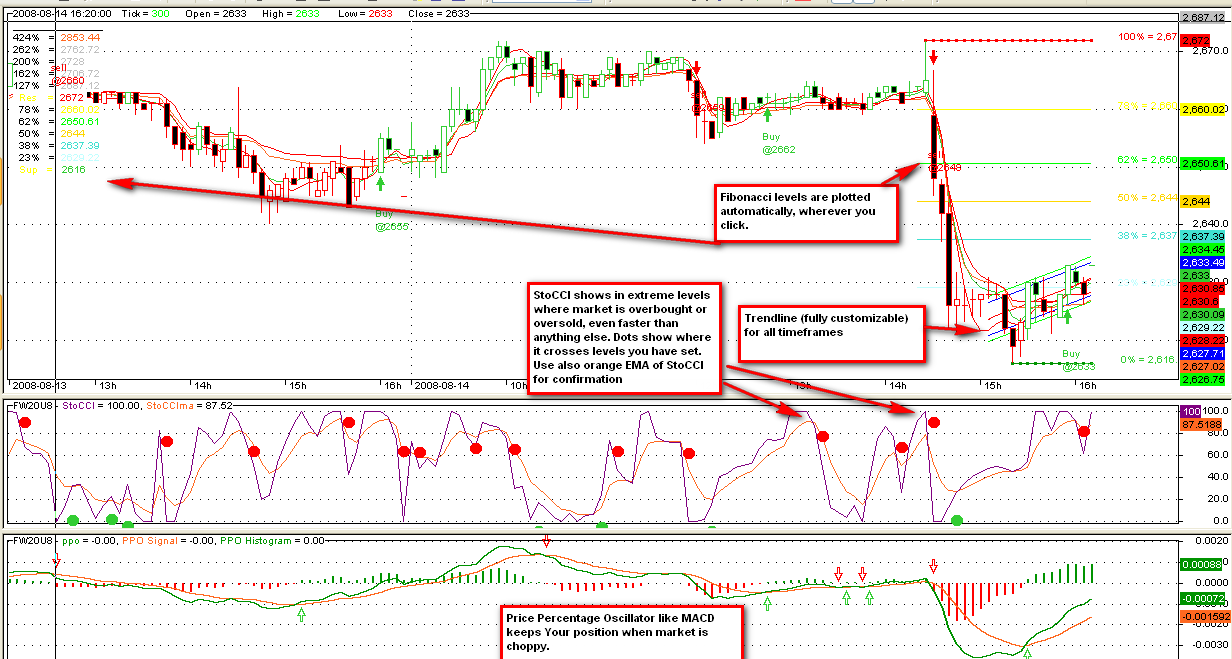
KAMAS 1.0 System with StoCCI for Amibroker – AFL Code

KAMAS 1.0 is a user-friendly interesting system based on concepts provided byKaufmann – adaptative Ma’s, it is enhanced with StoCCI indicator, PPO indicator , auto-trendline and fibonacci cluster – auto fib levels wherever you click on the chart. Fully customizable. Of course You should optimize some parameters.

Based on technology provided by http://www.pcinvestor.com/ formerly stockcharts.com.

How to KAMAS 1.0 Trading System

Main windows shows signals. Also fibonnacci levels are provided. So You must be familiar with fibonnacci theory. There is pplotted possible trendline. You may set many parameters when right-clicking on AB panes.

When You have sell/short signal from StoCCI – it is when the indicator reaches 100 look for confirmation from PPO and Main windows (arrows and text). Opposite for buy/cover. Fib levels should help you find possible levels for support and resistance.

StoCCI – fully customizable – it shows signals when reachin 100 and 0, also when crossing EMA(movin average) and dots when it reaches desired levels of OB or OS – you set this levels with one-click .

Remmember – it is reasonable to look at (at least) two time frames . Hourly, 15, 5 min is desirable for comfort trading.

You may look for divergences on PPO , treat StoCCI as faster “brother” of PPO and You will be faster then others in crowd.

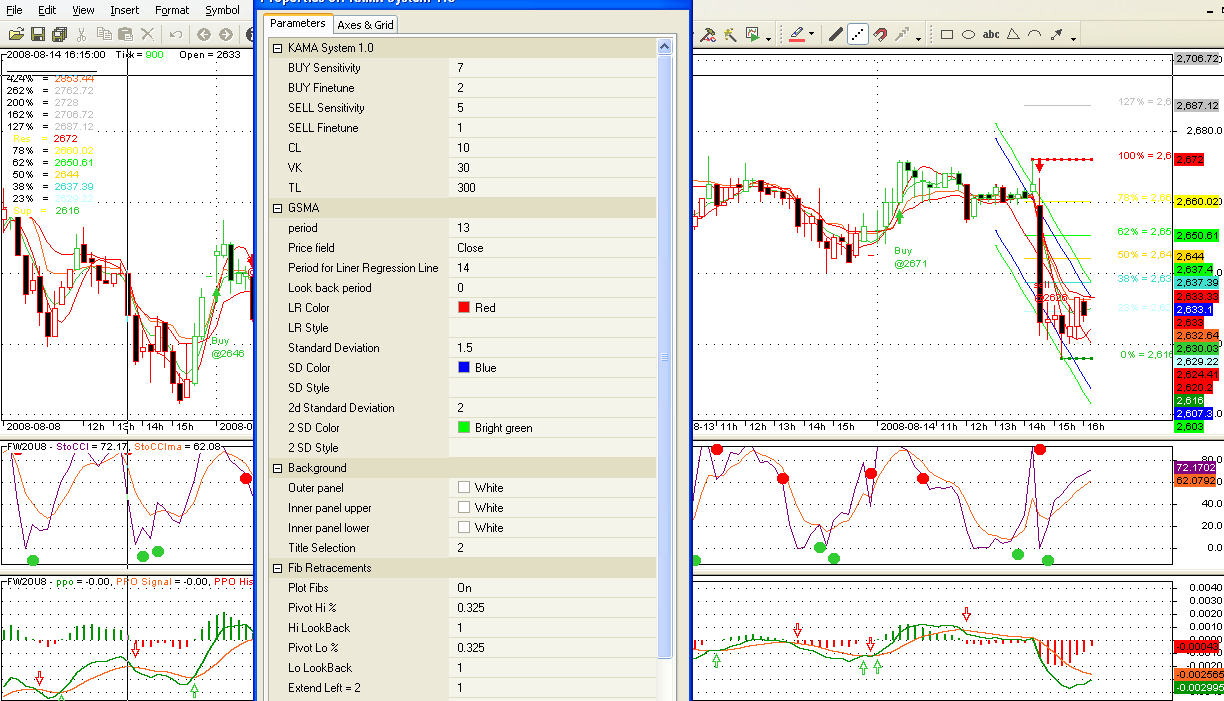
Here is view of used parameters in screenshot. If anything is not clear just look at the code (edit) and You will no more .. this stuff is open code!

To install system just copy and paste alle 3 files to FOrmulas/custom in AB directory.

Download the KAMAS System 1.0

The Foundation by Southwind v-13.00 Int AFL Code

The Foundation by Southwind v-13.00 Int AFL Code

21 February 2010 4,649 views 30 Comments

Here is an interesting and colourful AFL code which i found it over the web coded by Mr.Southwind(Dont know who he was… But simply the AFL code reads so).

Southwind AFL Code for Nifty

Southwind AFL Code for Nifty

When i explored the AFL code it contains the Heiken Ashi candle and as usual ATR trailing stop loss line along with the Heiken Ashi candle. And more technical indications like Support-Resistance Pivot Basic Stochastic ,RSI ,MACD and few more technical interpretations on the left side of the charting space. At a first time giving a impression that the trading system is much complicated. But it all just a combo Package of simple trading interpretations. Moreover I hadn’t explored much with this indicator. If you have free time then just go through the indicator. The color of the Heiken Ashi candle shows blue color for the uptrend and yellow for the sideways trend and the red color to indicate the downtrend. The Colored Candles of nifty daily chart is shown above. Just click on the picture to have a bigger view

Download The Foundation by Southwind v-13.00 Int AFL Code

http://www.marketcalls.in/wp-content/uploads/afl%20codes/Foundation-Int.rar

To Install this indicator

1)Extract the Foundation-Int.rar and save it in your local hard drive

2)Copy JurikLib.dll and kpami.dll and paste it in your Amibroker Plugin folder which is by default C:\Program Files\AmiBroker\Plugins

3)Copy T3_include.afl to the AFL formula-include folder which is by default C:\Program Files\AmiBroker\Formulas\Include

4)Copy The Foundation v13.00.afl and paste it in AFL formula-custom folder C:\Program Files\AmiBroker\Formulas\Custom

5)Now to view the charts Open Amibroker and goto File->New->New Chart

6)then goto View->Charts and select the afl from the left plane under the Custom folder

7)Then set the background to black. To do so goto Tools->Preference and select the color tab and set the background color to Black

Its all done now the colourful AFL is ready!

If you find more explorations with this AFL then do share it here too

Related Readings and Observations

  • KAMAS 1.0 System with StoCCI for Amibroker – AFL Code
    KAMAS 1.0 is a user-friendly interesting system based on concepts provided byKaufmann - adaptative Ma's, it is enhanced with StoCCI indicator, PPO indicator , auto-trendline and fibonacci cluster - auto fib levels wherever you click on the chart. Ful...
  • 70/1030 EMA AFL code for Amibroker
    Here is a simple logic how to plot 70min/ 1030min EMA in your amiboker software. 70/1030 EMA crossover is a popular strategy witht the yahoo 5min charts. And if your tried with amibroker with the same 70min and 1030 min you would probably end with th...
  • Ichimoku Cloud AFL code
    Simple AFL code for Ichimoku Cloud Charts are given here which plots only the Ichimoku cloud charts for any kind of timeframe. As usual Ichimoku performs a high role in high probability trading and this can be applied to any kind of time frame. The d...

01 June 2010

dO YOU ALWAYS OPERATE IN ZONE OF "I DONT KNOW" ?

JUST SEE
from where you got this chart? I dont know. any website? I dont know.Can you give more clearcut info? I dont know
To add to this uncertainty, another guy comes and says"hide this-dont show this"
Really disappointing .
hundreds thousands of readers visit this forum and all you try to do is give them more confusion or increase their confusion.

Why this creation of confusion and ambiguity?A forum is there to break the confusions .
Learn to be clear,simple,and informative.

So you are operarting in the "I DONT KNOW " Zone.

please first come out of it.

By the way there is nothing great about this chart or afl?
NO, NOT AT ALL.

It simply shows highs and lows,PIVOTS which are done wonderfully by Gordon Rose formula.but after a detection delay of 3 bars. It draws support resistance lines the PE of Amibroker does it great. it draws colored bars in haikin ashi format.This is readiliy available in Amibroker Library.

Learn things that work in any time frame and that work always.
Since I am not a "I DONT KNOW", I give some info here.

Following things work always.
Most fundamental thing is SUPPLY AND DEMAND condition of market.
If market is in balance and equilibrium between Demand and Supply, it goes in a range bound movement, if market is out of balance,which means either demand has beaten supply or supply overtook demand,then market is out of balance and you get trading opportunities which you must take as soon as possible.
Not knowing support and resistance means you go round the world and come back to square one.

prime concepts

1.Support and Resistance from pattern explorer
2.Fibonacci recognition from PE(shows where mkt went and where it can go-A leading Indicator)
3.BREAKOUT FORMULA(AFL example by Graham)(it works only when mkt is in breakout mood and it detects immediately)
4.Catch the first hour breakout and targets of 1.618, and 2.618 up or down,-Amibroker forums

note
If you agree with me, post thanks.
If you are hesitating to say yes or no, then God bless you to get bolder asap.
http://dsebd.org/

lassy/simsim


classy/simsim123

My Blog List

Total Pageviews

Search This Blog

Followers

Blog Archive