10 Best Candlestick Patterns
There are many candlestick patterns but only a few are actually worth knowing. Here are 10 candlestick patterns worth looking for.
Remember that these patterns are only useful when you understand what is happening in each pattern.
They must be combined with other forms of technical analysis to really be useful. For example, when you see one of these patterns on the daily chart, move down to the hourly chart. Does the hourly chart agree with your expectations on the daily chart? If so, then the odds of a reversal increase.
The following patterns are divided into two parts: Bullish patterns and bearish patterns. These are reversal patterns that show up after a pullback (bullish patterns) or a rally (bearish patterns).
Bullish Candlestick Patterns

Engulfing: This is my all time favorite candlestick pattern. This pattern consists of two candles. The first day is a narrow range candle that closes down for the day. The sellers are still in control of the stock but because it is a narrow range candle and volatility is low, the sellers are not very aggressive. The second day is a wide range candle that “engulfs” the body of the first candle and closes near the top of the range. The buyers have overwhelmed the sellers (demand is greater than supply). Buyers are ready to take control of this stock!
Hammer: As discussed on the previous page, the stock opened, then at some point the sellers took control of the stock and pushed it lower. By the end of the day, the buyers won and had enough strength to close the stock at the top of the range. Hammers can develop after a cluster of stop loss orders are hit. That’s when professional traders come in to grab shares at a lower price.
Harami: When you see this pattern the first thing that comes to mind is that the momentum preceding it has stopped. On the first day you see a wide range candle that closes near the bottom of the range. The sellers are still in control of this stock. Then on the second day, there is only a narrow range candle that closes up for the day. Note: Do not confuse this pattern with the engulfing pattern. The candles are opposite!
Piercing: This is also a two-candle reversal pattern where on the first day you see a wide range candle that closes near the bottom of the range. The sellers are in control. On the second day you see a wide range candle that has to close at least halfway into the prior candle. Those that shorted the stock on first day are now sitting at a loss on the rally that happens on the second day. This can set up a powerful reversal.
Doji: The doji is probably the most popular candlestick pattern. The stock opens up and goes nowhere throughout the day and closes right at or near the opening price. Quite simply, it represents indecision and causes traders to question the current trend. This can often trigger reversals in the opposite direction.
Bearish Candlestick Patterns

You’ll notice that all of these bearish patterns are the opposite of the bullish patterns. These patterns come after a rally and signify a possible reversal just like the bullish patterns.
Ok, now it’s your turn! I’ll let you figure out what is happening in each of the patterns above to cause these to be considered bearish. Look at each candle and try to get into the minds of the traders involved in the candle.
Kickers
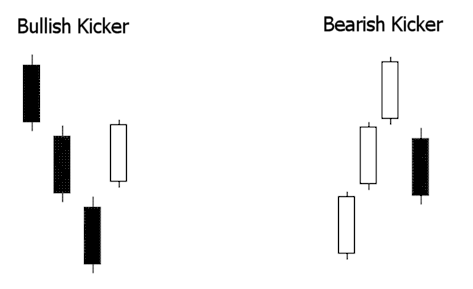
There is one more pattern worthy of mention. A "kicker" is sometimes referred to as the most powerful candlestick pattern of all.

You can see in the above graphic why this pattern is so explosive. Like most candle patterns there is a bullish and bearish version. In the bullish version, the stock is moving down and the last red candle closes at the bottom of the range.
Then, on the next day, the stock gaps open above the previous days high and close. This "shock event" forces short sellers to cover and brings in new traders on the long side.
This is reversed in the bearish version.
Confirmation?
Most traders are taught to "wait for confirmation" with candlestick patterns. This means that they are supposed to wait until the following day to see if the stock reverses afterward. This is absolutely ridiculous!
I ain’t waitin’ for no stinkin’ confirmation!
How’s that for good grammar! Seriously, think about it for a second. If a stock pulls back to an area of demand (support) and I have a candlestick pattern that is telling me that buyers are taking control of the stock, then that is all the confirmation I need.
As a swing trader I have to get in before the crowd piles in, not when they get in! In other words, I want to be one of the traders that make up the pattern itself! That is the low risk, high odds play.
Just the way I like it.
No comments:
Post a Comment