01 December 2012

Force Index Indicator mt4

  Force Index Indicator measures the Bulls Power at each increase, and the Bulls Power at each decrease. It connects the basic elements of market information: price trend, its drops, and volumes of transactions. This index can be used as it is, but it is better to approximate it with the help of Moving Average. Approximation with the help a short moving average ( 2 intervals) contributes to finding the best opportunity to open and close positions. If the approximations is made with long moving average (period 13), the index shows the trends and their changes.

  • It is better to buy when the forces become minus (fall below zero) in the period of indicator increasing tendency;
  • The force index signalizes the continuation of the increasing tendency when it increases to the new peak;
  • The signal to sell comes when the index becomes positive during the decreasing tendency;
  • The force index signalizes the Bears Power and continuation of the decreasing tendency when the index falls to the new trough;
  • If price changes do not correlate to the corresponding changes in volume, the force indicator stays on one level, which tells you the trend is going to change soon.
    Calculation
    The force of every market movement is characterized by its direction, scale and volume. If the closing price of the current bar is higher than the preceding bar, the force is positive. If the current closing price if lower than the preceding one, the force is negative. The greater the difference in prices is, the greater the force is. The greater the transaction volume is, the greater the force is.

    FORCE INDEX (i) = VOLUME (i) * ((MA (ApPRICE, N, i) - MA (ApPRICE, N, i-1))

    where:
FORCE INDEX (i) — Force Index of the current bar;
VOLUME (i) — volume of the current bar;
MA (ApPRICE, N, i) — any Moving Average of the current bar for N period:
Simple, Exponential, Seighted or Smoothed;
ApPRICE — applied price;
N — period of the smoothing;
MA (ApPRICE, N, i-1) — any Moving Average of the previous bar.

Technical Indicator Description

Full description of FRC is available in the Technical analysis: Force Index

bbb bolinger band blust

09 June 2012

Pip Cost

Hello ,

Many people have been asking about the value per pip when trading micro lots.

The value of a pip is determined by the pair of currencies being traded, the rate at which the currency pair is trading and the size of the position being traded.

Remember a micro lot is 1k in currency traded. This is opposed to a 10k mini or 100k standard lot.

The following currency pairs (where the USD is the quoted currency) have a fixed value of $0.10 per pip per micro lot: EUR/USD, GBP/USD, AUD/USD, NZD/USD.


To calculate the value of other pairs, which have a fluctuating pip value you can apply a simple calculation such as the example below.

Lets say you are trading the euro at 1.3500 for one micro lot.

When the exchange rate moves from 1.3500 to 1.3501, the value of your 1,000 Euro position has increased from $1,350 USD to $1,350.10. Pip value = $0.10.

That means if you trade a 10k lot that means you would earn $1 a pip.
.10 (per micro) x 10 = $1

K in general means 1 thousand (1 000).

1 micro lot = 1K = 1 000 units of currency,

For example if you are buying 1K (1 micro lot) of EUR/USD at $1.2000 you are buying 1 000 Euros with 1 200 US dollars.

If you are buying 10K (1 mini lot) of EUR/USD at $1.2000 you are buying 10 000 Euros with 12 000 US dollars.

If you are buying 100K (1 standard lot) of EUR/USD at $1.2000 you are buying 100 000 Euros with 120 000 US dollars.

Simplest way to understand how to calculate pip depends upon the currency pair involves. We start considering the situation when the US dollar is the quote currency as in the case of JPY/USD, GBP/USD or CHF/USD. Here calculating pip is very easy as pip has always a value of $10. As a standard Inter Bank lot size is 100000 and the pip is usually 0.01% hence the value of the pip comes to $10. So, while trading JPY/USD the market moves in your favor by 10 pips that mean you make a profit of $100.

If you want further clarification on pips you can check my blog
 

pips and stops micro

I think I understand the fractional pip concept and the bid/ask--buy/sell --spread that determines where you will be exiting BUT
I'm having issues with the distance the stop order is requiring.

For example, a sell price is .63799 and the spread is 2.5
I want to set a stop at .63845 --which is 4.6 pips, correct? but it won't allow a stop below .63851, which is 5.2 pips.
Since the stop I want to set is greater than the spread, why won't it allow it?

Is there a rationale to explain this?


Quote Originally Posted by knotgreedy View Post
I just opened a micro and then watched a tutoial that said a 10K lot will cost $25.00 to execute /close. Is this right? . I never saw this charge during my demo acct. Could one of you veterans explain this. Thanks
You may be misinterpreting margin as a cost. When you open one microlot, which is 1,000 of the currency you are trading, you need at least $2.50 in your account as margin to control the position. If you open 10 microlots or 10,000 of the currency you are trading, you need $25 in margin money to control the position. Here is more:

Margins and Leverage Explained | FXCM Micro Lot Spread and Margin
Enroll in our online DailyFX Course today and get personalized instruction from our team of expert traders 24 hours a day. We have taught over 25,000 students and in our online courses in the past. The new DailyFX Course has nearly 600 minutes of content delivered via video so you can learn at your own pace. Join the instructors in live webinars where they will show you how to use the highlighted tool in current market conditions. Click here to get more information.

06 May 2012

Excellent website..Cool

I Got this address from net.I would like to share it ..all credit goes to original host/hostes

http://www.brtricks.com/2012/05/license-keys-of-kaspersky-products-05th.html

21 April 2012

ZIG HI LO SAR HH LL TS TC

/*
Zig-Hi-Zag-Lo

To use to plot the true Peak High and Trough Low
for study of chart pattern, to create trading system

Modified from http://trader.online.pl/MSZ/e-w-ZigZag_HiLo.html

By TohMz
*/
pr=Param("ZigZag change amount", 5, 0.1,100,0.1);

pk=PeakBars(H,pr)==0;
tr=TroughBars(L,pr)==0;

zzHi=Zig(H,pr);
zzLo=Zig(L,pr);
Avg=(zzHi+zzLo)/2;

x=IIf(pk,zzHi,IIf(tr,zzLo,IIf(Avg>Ref(Avg,-1),H,L)));
zzHiLo=Zig(x,pr);

Plot( zzHiLo, "", ParamColor("Color",colorRed), ParamStyle("Style"));

//-- Delete below, to allow attach to any price chart
_N(Title = StrFormat("{{NAME}}- {{INTERVAL}} {{DATE}} O= %g, H= %g, L= %g, C= %g (%.1f%%) V= " +WriteVal( V, 1.0 ) +"\n{{VALUES}}", O, H, L, C, SelectedValue( ROC( C, 1 )) ));
PriceStyle = GetPriceStyle();
PriceStyleOpt = ParamStyle("Style") | PriceStyle;

if (PriceStyle==styleCandle)
Plot( C, "", colorWhite, PriceStyleOpt);
else
Plot( C, "", IIf( Close >= Ref(C, -1), colorBlue, colorRed ), PriceStyleOpt);

_SECTION_BEGIN("Sup / Res Lines");
SRswitch = ParamToggle("Sup / Res Lines","On,Off");
CHLswitch = ParamToggle("Hi Low / Close","Hi Low,Close");
NoLines = Param("No of Lines",3,1,10,1);
Sen = Param("Sensitivity",5,1,100,1);

Rcolor=ParamColor( "Res Color", colorGreen );
Rstyle=ParamStyle( "Res Style", styleLine );

Scolor=ParamColor( "Sup Color", colorBrown );
Sstyle=ParamStyle( "Sup Style", styleLine );

y=0;
x=0;

for( i = 1; i < NoLines+1 ; i++ ) { Y[i]=LastValue(Peak(IIf(CHLswitch,C,H),Sen,i)); x[i]=BarCount - 1 - LastValue(PeakBars(IIf(CHLswitch,C,H),Sen,i)); Line = LineArray( x[i], y[i], Null, y[i], 1 ); Plot( IIf(SRswitch,Null,Line), "", Rcolor, Rstyle ); Y[i]=LastValue(Trough(IIf(CHLswitch,C,L),Sen,i)); x[i]=BarCount - 1 - LastValue(TroughBars(IIf(CHLswitch,C,L),Sen,i)); Line = LineArray( x[i], y[i], Null, y[i], 1 ); Plot( IIf(SRswitch,Null,Line), "", Scolor, Sstyle ); } _SECTION_END(); _SECTION_BEGIN("Pivot Indicator"); Q=Param("% Change",2,1,10,1); Z= Zig(C,q ) ; HH=((Z Ref(Z,-2)) AND (Peak(z,q,1 ) >Peak(Z,q,2)));
LH=((Z Ref(Z,-2)) AND (Peak(Z,q,1 ) Ref(Z,-1) AND Ref(Z,-1) < Ref(Z,-2)) AND (Trough(Z,q,1 ) >Trough(Z,q,2)));
LL=((Z>Ref(Z,-1) AND Ref(Z,-1) < Ref(Z,-2)) AND (Trough(Z,q,1 ) GraphXSpace = 5;
dist = 0.5*ATR(20);

for( i = 0; i < BarCount; i++ )
{
if( HH [i]) PlotText( "HH", i, H[ i ]+dist[i], colorGreen );
if( LH [i]) PlotText( "LH", i, H[ i ]+dist[i], colorRed );
if( HL [i] ) PlotText( "HL", i, L[ i ]-dist[i], colorGreen);
if( LL[i] ) PlotText( "LL", i, L[ i ]-dist[i], colorRed );

}
_SECTION_END();

16 April 2012

add this line to explore afl

all credit goes to Avadhoot Nasikkar

Have you ever perturbed with ‘1’ & ‘0’ in the Buy/Sell column of the exploration window in the Amibroker?
Just Rejoice!
Put this simple line in your exploration and you shall see ‘Buy’ & ‘Sell’ in the exploration window that too with colour background, green for Buy and Red for Sell.

And that line is-

AddTextColumn( WriteIf(Buy,"BUY",WriteIf(Sell,"SELL","")) , "Buy/Sell", 1.2 , colorBlack, IIf( Buy, colorLime,IIf(Sell,colorRed,colorGreen) ));

25 March 2012

WAVE ATR

// Supertrend - Translated from Kolier MQ4
// see: http://kolier.li/indicator/kolier-supertrend-indi
// translation in Amibroker AFL code by E.M.Pottasch, 2011

procedure calcTrend_proc(ATR_Period,tr,ATR_Multiplier,TrendMode,CalcPrice)
{
global buffer_line_down;
global buffer_line_up;
buffer_line_down = Null;
buffer_line_up = Null;

PHASE_NONE = 0;
PHASE_BUY = 1;
PHASE_SELL = -1;

phase=PHASE_NONE;
band_upper = 0;band_lower = 0;

for(i = ATR_Period + 1; i < BarCount; i++) { band_upper = CalcPrice[i] + ATR_Multiplier * tr[i]; band_lower = CalcPrice[i] - ATR_Multiplier * tr[i]; if(phase==PHASE_NONE) { buffer_line_up[i] = CalcPrice[i]; buffer_line_down[i] = CalcPrice[i]; } if(phase!=PHASE_BUY && Close[i]>buffer_line_down[i-1] && !IsEmpty(buffer_line_down[i-1]))
{
phase = PHASE_BUY;
buffer_line_up[i] = band_lower;
buffer_line_up[i-1] = buffer_line_down[i-1];
}
if(phase!=PHASE_SELL && Close[i]buffer_line_up[i-1])
{
buffer_line_up[i] = band_lower;
}
else
{
buffer_line_up[i] = buffer_line_up[i-1];
}
}
if(phase==PHASE_SELL && ((TrendMode==0 && !IsEmpty(buffer_line_down[i-2])) || TrendMode==1) )
{
if(band_upperRef(Avg,-1),H,L)));
EW=Zig(RetroSuccessSecret,pr);
//{ Plot on price chart }
if (Option==0)
Plot(EW, "EW", ParamColor("Color", colorBrown), ParamStyle("Style", styleNoLabel|styleThick));
else
{
//{ Plot on own window }
Plot(EWbuy-EWsell, "EW2", ParamColor("Color", colorRed), ParamStyle("Style", styleNoLabel|styleThick));
}
//{ Buy/Sell Elliot Wave stuff }
EWbuy=TroughBars(EW,pr)==1;
EWsell=PeakBars(EW,pr)==1;
Plot(C,"",47,128+4);
PlotShapes(EWbuy*shapeUpArrow,5,0,L,-5);
PlotShapes(EWsell*shapeDownArrow,4,0,H,-5);
//-- Script End -------
_SECTION_END();

ZIG HI LO

/*
Zig-Hi-Zag-Lo

To use to plot the true Peak High and Trough Low
for study of chart pattern, to create trading system

Modified from http://trader.online.pl/MSZ/e-w-ZigZag_HiLo.html

By TohMz
*/
pr=Param("ZigZag change amount", 5, 0.1,100,0.1);

pk=PeakBars(H,pr)==0;
tr=TroughBars(L,pr)==0;

zzHi=Zig(H,pr);
zzLo=Zig(L,pr);
Avg=(zzHi+zzLo)/2;

x=IIf(pk,zzHi,IIf(tr,zzLo,IIf(Avg>Ref(Avg,-1),H,L)));
zzHiLo=Zig(x,pr);

Plot( zzHiLo, "", ParamColor("Color",colorRed), ParamStyle("Style"));

//-- Delete below, to allow attach to any price chart
_N(Title = StrFormat("{{NAME}}- {{INTERVAL}} {{DATE}} O= %g, H= %g, L= %g, C= %g (%.1f%%) V= " +WriteVal( V, 1.0 ) +"\n{{VALUES}}", O, H, L, C, SelectedValue( ROC( C, 1 )) ));
PriceStyle = GetPriceStyle();
PriceStyleOpt = ParamStyle("Style") | PriceStyle;

if (PriceStyle==styleCandle)
Plot( C, "", colorWhite, PriceStyleOpt);
else
Plot( C, "", IIf( Close >= Ref(C, -1), colorBlue, colorRed ), PriceStyleOpt);

_SECTION_BEGIN("Sup / Res Lines");
SRswitch = ParamToggle("Sup / Res Lines","On,Off");
CHLswitch = ParamToggle("Hi Low / Close","Hi Low,Close");
NoLines = Param("No of Lines",3,1,10,1);
Sen = Param("Sensitivity",5,1,100,1);

Rcolor=ParamColor( "Res Color", colorGreen );
Rstyle=ParamStyle( "Res Style", styleLine );

Scolor=ParamColor( "Sup Color", colorBrown );
Sstyle=ParamStyle( "Sup Style", styleLine );

y=0;
x=0;

for( i = 1; i < NoLines+1 ; i++ )
{
Y[i]=LastValue(Peak(IIf(CHLswitch,C,H),Sen,i));
x[i]=BarCount - 1 - LastValue(PeakBars(IIf(CHLswitch,C,H),Sen,i));
Line = LineArray( x[i], y[i], Null, y[i], 1 );
Plot( IIf(SRswitch,Null,Line), "", Rcolor, Rstyle );

Y[i]=LastValue(Trough(IIf(CHLswitch,C,L),Sen,i));
x[i]=BarCount - 1 - LastValue(TroughBars(IIf(CHLswitch,C,L),Sen,i));
Line = LineArray( x[i], y[i], Null, y[i], 1 );
Plot( IIf(SRswitch,Null,Line), "", Scolor, Sstyle );
}
_SECTION_END();

FVE

_SECTION_BEGIN("FVE INTRA");
Period = Param("FVE period", 22, 10, 80, 1 );

MF = C - (H+L)/2 + Avg - Ref( Avg, -1 );
Vc = IIf( MF > 0.003 * C, V,
IIf( MF < -0.003 * C, -V, 0 ) ); FVE = Sum( Vc, Period )/MA( V, Period )/Period * 100; Plot( FVE, "FVE", colorLime ); GraphXSpace = 3; Buy = Cross( FVE, -5 ) AND LinRegSlope( FVE, 35 ) > 0 AND
LinRegSlope( Close, 35 ) < 0;
Sell = LinRegSlope( FVE, 25 ) < 0 OR Ref( Buy, -50 );
_SECTION_END();

FVE

_SECTION_BEGIN("FVE INTRA");
Period = Param("FVE period", 22, 10, 80, 1 );

MF = C - (H+L)/2 + Avg - Ref( Avg, -1 );
Vc = IIf( MF > 0.003 * C, V,
IIf( MF < -0.003 * C, -V, 0 ) ); FVE = Sum( Vc, Period )/MA( V, Period )/Period * 100; Plot( FVE, "FVE", colorLime ); GraphXSpace = 3; Buy = Cross( FVE, -5 ) AND LinRegSlope( FVE, 35 ) > 0 AND
LinRegSlope( Close, 35 ) < 0;
Sell = LinRegSlope( FVE, 25 ) < 0 OR Ref( Buy, -50 );
_SECTION_END();

FVE

_SECTION_BEGIN("FVE INTRA");
Period = Param("FVE period", 22, 10, 80, 1 );

MF = C - (H+L)/2 + Avg - Ref( Avg, -1 );
Vc = IIf( MF > 0.003 * C, V,
IIf( MF < -0.003 * C, -V, 0 ) ); FVE = Sum( Vc, Period )/MA( V, Period )/Period * 100; Plot( FVE, "FVE", colorLime ); GraphXSpace = 3; Buy = Cross( FVE, -5 ) AND LinRegSlope( FVE, 35 ) > 0 AND
LinRegSlope( Close, 35 ) < 0;
Sell = LinRegSlope( FVE, 25 ) < 0 OR Ref( Buy, -50 );
_SECTION_END();

STOCH K CROSS STOCH D +- TREND LINE SHOW

_SECTION_BEGIN("stoch k cross stoch d +ve");
/*Slow Stochastic and Trendlines
for Indicator Builder,
by Dimitris Tsokakis*/
D1=14;
MaxGraph=8;
ST3=StochK(D1);
ST33=StochD(D1);
Graph0=ST3;
Graph1=ST33;
Title=Name()+" - %K="+WriteVal(st3,FORMAT=1.2)+", %D="+
WriteVal(ST33,FORMAT=1.2)+
WriteIf(Cross(st3,st33)," POSITIVE CROSS"," ")+
WriteIf(Cross(ST33,ST3)," NEGATIVE CROSS","");
x = Cum(1);
per = 0.1;
s1=st33;
s11=st33;
pS = TroughBars( s1, per, 1 ) == 0;
endt= LastValue(ValueWhen( pS, x, 1 ));
startt=LastValue(ValueWhen( pS, x, 2 ));
dtS =endt-startt;
endS = LastValue(ValueWhen( pS, s1, 1 ) );
startS = LastValue( ValueWhen( pS, s1, 2 ));
aS = (endS-startS)/dtS;
bS = endS;
trendlineS = aS * ( x -endt ) + bS;
Graph6 = IIf(x>startt-1 AND TRENDLINES>0 AND TRENDLINES<100,trendlineS,-1e10); Graph6Style = 1; Graph6Color = 1; pR = PeakBars( s11, per, 1 ) == 0; endt1= LastValue(ValueWhen( pR, x, 1 )); startt1=LastValue(ValueWhen( pR, x, 2 )); dtR =endt1-startt1; endR = LastValue(ValueWhen( pR, s11, 1 ) ); startR = LastValue( ValueWhen( pR, s11, 2 )); aR = (endR-startR)/dtR; bR = endR; trendlineR = aR * ( x -endt1 ) + bR; Graph7 = IIf(x>startT1-1 AND TRENDLINER>0 AND
TRENDLINER<100,trendlineR,-1e10);
Graph7Style = 1;
Graph7Color = 1;
_SECTION_END();

31 January 2012

Fibonacci Numbers

Overview
Fibonacci numbers are the result of work by Leonardo Fibonacci in the early 1200's while studying the Great Pyramid of Gizeh. The fibonacci series is a numerical sequence comprised of adding the previous numbers together, i.e.,

(1,2,3,5,8,13,21,34,55,89,144,233 etc..)

An interesting property of these numbers is that as the series proceeds, any given number is 1.618 times the preceding number and 0.618% of the next number.

(34/55 = 55/89 = 144/233 =0.618) (55/34 =89/55 =233/144 =1.618), and 1.618 =1/0.618.

This properties of the fibonacci series occur throughout nature, science and math and is the number 0.618 is often referred to as the "golden ratio" as it is the root of the following polynomial x^2+x-1=0 which can be rearranged to x= 1/(1+x).

So that's were the fib # 0.618 comes from. The other fibs 0.382 and 0.5 commonly used in technical analysis have a less impressive background but are just as powerful in Technical analysis.

0.382=(1-.618)=(0.618*0.618)

and 0.5 is the mean of the two numbers.

Other neat fib facts (0.618*(1+0.618)=1 and (0.382*(1+.618))=0.618.

Use of Fibonacci #'s in Technical Analysis
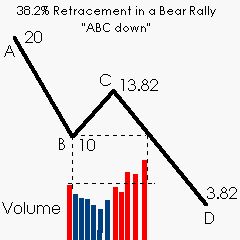
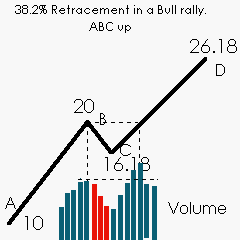
Fibonacci numbers are commonly used in Technical Analysis with or without a knowledge of Elliot wave analysis to determine potential support, resistance, and price objectives. 38.2% retracements usually imply that the prior trend will continue, 61.8% retracements imply a new trend is establishing itself. A 50% retracement implies indecision. 38.2% retracements are considered nautral retracements in a healthy trend.

ABC's
Price objectives for a natural retracement (38.2%) can be determined by adding (or subtracting in a downtrend) the magnitude of the previous trend to the 38.2% retracement. After the 38.2% retracement the stock should break through the previous swing point(B) on heavier volume. If the volume isn't there the magnitude of the move will usually be diminished, especially on very low volume.


A-B =C-D when B-C =38.2% of A-B

61.8% retracements are warning signs of a potential trend changes. For a more detailed explanation of Fibonacci price projections and price wave theory I highly recommend the Elliot Wave Principle links below.

Confluence Confluence occurs when you take fibonacci projections off of multiple trends and get the same number and strengthens when it corresponds with other technical advents such as gaps, swing high/lows, chart indicators crossovers (MACD, RSI, Stochastics, etc.), trading congestion, etc. The more confluence, the more significant the level. I really take notice when I get two or more fib #s (say a 38.2% and 61.8%) to correspond with a gap in the chart or a swing high. Confluence is very powerful as it combines multiple technical analysis techniques to arrive at the same conclusion, and should be relied on accordingly IMHO

Trading Strageties JMHO

Once a new swing point is established in an equity, a new set of fibonacci numbers should be calculated, and confluence checked to determine potential support/resistance levels and trading strategies. (let the Fibonacci Calculator do most of the work for you). For instance:


If a stock is trending up, one may watch it until it forms a top then calculate the fibs. If she retraces 38.2% and turns with confluence, one could bite with an automatic stop under the 50% retracement and objective of the ABC. The Risk/Reward ratio for that trade is 0.118. (If you got stopped out 8 times and hit once you would have a 5.6% profit).

If she's trending down, you could bite at the 38.2% bounce with a stop at the 50% and get the same risk/reward ratio. With both strategies it is critical for the volume to be heavier on the swing point breakout.

If a position is going with you and you're looking for an exit point, calculate the 38.2% fib once a top is clear and put a stop below it. Won't get you out at the top but you may not miss that monster rally either.

Think a stock is a dog but it's trading at it's high wait for a 61.8% retracement from the last trend and sell it, with the stop below the 50% retracement.

My Blog List

Total Pageviews

Search This Blog

Followers