01 December 2012

Force Index Indicator mt4

  Force Index Indicator measures the Bulls Power at each increase, and the Bulls Power at each decrease. It connects the basic elements of market information: price trend, its drops, and volumes of transactions. This index can be used as it is, but it is better to approximate it with the help of Moving Average. Approximation with the help a short moving average ( 2 intervals) contributes to finding the best opportunity to open and close positions. If the approximations is made with long moving average (period 13), the index shows the trends and their changes.

  • It is better to buy when the forces become minus (fall below zero) in the period of indicator increasing tendency;
  • The force index signalizes the continuation of the increasing tendency when it increases to the new peak;
  • The signal to sell comes when the index becomes positive during the decreasing tendency;
  • The force index signalizes the Bears Power and continuation of the decreasing tendency when the index falls to the new trough;
  • If price changes do not correlate to the corresponding changes in volume, the force indicator stays on one level, which tells you the trend is going to change soon.
    Calculation
    The force of every market movement is characterized by its direction, scale and volume. If the closing price of the current bar is higher than the preceding bar, the force is positive. If the current closing price if lower than the preceding one, the force is negative. The greater the difference in prices is, the greater the force is. The greater the transaction volume is, the greater the force is.

    FORCE INDEX (i) = VOLUME (i) * ((MA (ApPRICE, N, i) - MA (ApPRICE, N, i-1))

    where:
FORCE INDEX (i) — Force Index of the current bar;
VOLUME (i) — volume of the current bar;
MA (ApPRICE, N, i) — any Moving Average of the current bar for N period:
Simple, Exponential, Seighted or Smoothed;
ApPRICE — applied price;
N — period of the smoothing;
MA (ApPRICE, N, i-1) — any Moving Average of the previous bar.

Technical Indicator Description

Full description of FRC is available in the Technical analysis: Force Index

bbb bolinger band blust

09 June 2012

Pip Cost

Hello ,

Many people have been asking about the value per pip when trading micro lots.

The value of a pip is determined by the pair of currencies being traded, the rate at which the currency pair is trading and the size of the position being traded.

Remember a micro lot is 1k in currency traded. This is opposed to a 10k mini or 100k standard lot.

The following currency pairs (where the USD is the quoted currency) have a fixed value of $0.10 per pip per micro lot: EUR/USD, GBP/USD, AUD/USD, NZD/USD.


To calculate the value of other pairs, which have a fluctuating pip value you can apply a simple calculation such as the example below.

Lets say you are trading the euro at 1.3500 for one micro lot.

When the exchange rate moves from 1.3500 to 1.3501, the value of your 1,000 Euro position has increased from $1,350 USD to $1,350.10. Pip value = $0.10.

That means if you trade a 10k lot that means you would earn $1 a pip.
.10 (per micro) x 10 = $1

K in general means 1 thousand (1 000).

1 micro lot = 1K = 1 000 units of currency,

For example if you are buying 1K (1 micro lot) of EUR/USD at $1.2000 you are buying 1 000 Euros with 1 200 US dollars.

If you are buying 10K (1 mini lot) of EUR/USD at $1.2000 you are buying 10 000 Euros with 12 000 US dollars.

If you are buying 100K (1 standard lot) of EUR/USD at $1.2000 you are buying 100 000 Euros with 120 000 US dollars.

Simplest way to understand how to calculate pip depends upon the currency pair involves. We start considering the situation when the US dollar is the quote currency as in the case of JPY/USD, GBP/USD or CHF/USD. Here calculating pip is very easy as pip has always a value of $10. As a standard Inter Bank lot size is 100000 and the pip is usually 0.01% hence the value of the pip comes to $10. So, while trading JPY/USD the market moves in your favor by 10 pips that mean you make a profit of $100.

If you want further clarification on pips you can check my blog
 

pips and stops micro

I think I understand the fractional pip concept and the bid/ask--buy/sell --spread that determines where you will be exiting BUT
I'm having issues with the distance the stop order is requiring.

For example, a sell price is .63799 and the spread is 2.5
I want to set a stop at .63845 --which is 4.6 pips, correct? but it won't allow a stop below .63851, which is 5.2 pips.
Since the stop I want to set is greater than the spread, why won't it allow it?

Is there a rationale to explain this?


Quote Originally Posted by knotgreedy View Post
I just opened a micro and then watched a tutoial that said a 10K lot will cost $25.00 to execute /close. Is this right? . I never saw this charge during my demo acct. Could one of you veterans explain this. Thanks
You may be misinterpreting margin as a cost. When you open one microlot, which is 1,000 of the currency you are trading, you need at least $2.50 in your account as margin to control the position. If you open 10 microlots or 10,000 of the currency you are trading, you need $25 in margin money to control the position. Here is more:

Margins and Leverage Explained | FXCM Micro Lot Spread and Margin
Enroll in our online DailyFX Course today and get personalized instruction from our team of expert traders 24 hours a day. We have taught over 25,000 students and in our online courses in the past. The new DailyFX Course has nearly 600 minutes of content delivered via video so you can learn at your own pace. Join the instructors in live webinars where they will show you how to use the highlighted tool in current market conditions. Click here to get more information.

06 May 2012

Excellent website..Cool

I Got this address from net.I would like to share it ..all credit goes to original host/hostes

http://www.brtricks.com/2012/05/license-keys-of-kaspersky-products-05th.html

21 April 2012

ZIG HI LO SAR HH LL TS TC

/*
Zig-Hi-Zag-Lo

To use to plot the true Peak High and Trough Low
for study of chart pattern, to create trading system

Modified from http://trader.online.pl/MSZ/e-w-ZigZag_HiLo.html

By TohMz
*/
pr=Param("ZigZag change amount", 5, 0.1,100,0.1);

pk=PeakBars(H,pr)==0;
tr=TroughBars(L,pr)==0;

zzHi=Zig(H,pr);
zzLo=Zig(L,pr);
Avg=(zzHi+zzLo)/2;

x=IIf(pk,zzHi,IIf(tr,zzLo,IIf(Avg>Ref(Avg,-1),H,L)));
zzHiLo=Zig(x,pr);

Plot( zzHiLo, "", ParamColor("Color",colorRed), ParamStyle("Style"));

//-- Delete below, to allow attach to any price chart
_N(Title = StrFormat("{{NAME}}- {{INTERVAL}} {{DATE}} O= %g, H= %g, L= %g, C= %g (%.1f%%) V= " +WriteVal( V, 1.0 ) +"\n{{VALUES}}", O, H, L, C, SelectedValue( ROC( C, 1 )) ));
PriceStyle = GetPriceStyle();
PriceStyleOpt = ParamStyle("Style") | PriceStyle;

if (PriceStyle==styleCandle)
Plot( C, "", colorWhite, PriceStyleOpt);
else
Plot( C, "", IIf( Close >= Ref(C, -1), colorBlue, colorRed ), PriceStyleOpt);

_SECTION_BEGIN("Sup / Res Lines");
SRswitch = ParamToggle("Sup / Res Lines","On,Off");
CHLswitch = ParamToggle("Hi Low / Close","Hi Low,Close");
NoLines = Param("No of Lines",3,1,10,1);
Sen = Param("Sensitivity",5,1,100,1);

Rcolor=ParamColor( "Res Color", colorGreen );
Rstyle=ParamStyle( "Res Style", styleLine );

Scolor=ParamColor( "Sup Color", colorBrown );
Sstyle=ParamStyle( "Sup Style", styleLine );

y=0;
x=0;

for( i = 1; i < NoLines+1 ; i++ ) { Y[i]=LastValue(Peak(IIf(CHLswitch,C,H),Sen,i)); x[i]=BarCount - 1 - LastValue(PeakBars(IIf(CHLswitch,C,H),Sen,i)); Line = LineArray( x[i], y[i], Null, y[i], 1 ); Plot( IIf(SRswitch,Null,Line), "", Rcolor, Rstyle ); Y[i]=LastValue(Trough(IIf(CHLswitch,C,L),Sen,i)); x[i]=BarCount - 1 - LastValue(TroughBars(IIf(CHLswitch,C,L),Sen,i)); Line = LineArray( x[i], y[i], Null, y[i], 1 ); Plot( IIf(SRswitch,Null,Line), "", Scolor, Sstyle ); } _SECTION_END(); _SECTION_BEGIN("Pivot Indicator"); Q=Param("% Change",2,1,10,1); Z= Zig(C,q ) ; HH=((Z Ref(Z,-2)) AND (Peak(z,q,1 ) >Peak(Z,q,2)));
LH=((Z Ref(Z,-2)) AND (Peak(Z,q,1 ) Ref(Z,-1) AND Ref(Z,-1) < Ref(Z,-2)) AND (Trough(Z,q,1 ) >Trough(Z,q,2)));
LL=((Z>Ref(Z,-1) AND Ref(Z,-1) < Ref(Z,-2)) AND (Trough(Z,q,1 ) GraphXSpace = 5;
dist = 0.5*ATR(20);

for( i = 0; i < BarCount; i++ )
{
if( HH [i]) PlotText( "HH", i, H[ i ]+dist[i], colorGreen );
if( LH [i]) PlotText( "LH", i, H[ i ]+dist[i], colorRed );
if( HL [i] ) PlotText( "HL", i, L[ i ]-dist[i], colorGreen);
if( LL[i] ) PlotText( "LL", i, L[ i ]-dist[i], colorRed );

}
_SECTION_END();

16 April 2012

add this line to explore afl

all credit goes to Avadhoot Nasikkar

Have you ever perturbed with ‘1’ & ‘0’ in the Buy/Sell column of the exploration window in the Amibroker?
Just Rejoice!
Put this simple line in your exploration and you shall see ‘Buy’ & ‘Sell’ in the exploration window that too with colour background, green for Buy and Red for Sell.

And that line is-

AddTextColumn( WriteIf(Buy,"BUY",WriteIf(Sell,"SELL","")) , "Buy/Sell", 1.2 , colorBlack, IIf( Buy, colorLime,IIf(Sell,colorRed,colorGreen) ));

25 March 2012

WAVE ATR

// Supertrend - Translated from Kolier MQ4
// see: http://kolier.li/indicator/kolier-supertrend-indi
// translation in Amibroker AFL code by E.M.Pottasch, 2011

procedure calcTrend_proc(ATR_Period,tr,ATR_Multiplier,TrendMode,CalcPrice)
{
global buffer_line_down;
global buffer_line_up;
buffer_line_down = Null;
buffer_line_up = Null;

PHASE_NONE = 0;
PHASE_BUY = 1;
PHASE_SELL = -1;

phase=PHASE_NONE;
band_upper = 0;band_lower = 0;

for(i = ATR_Period + 1; i < BarCount; i++) { band_upper = CalcPrice[i] + ATR_Multiplier * tr[i]; band_lower = CalcPrice[i] - ATR_Multiplier * tr[i]; if(phase==PHASE_NONE) { buffer_line_up[i] = CalcPrice[i]; buffer_line_down[i] = CalcPrice[i]; } if(phase!=PHASE_BUY && Close[i]>buffer_line_down[i-1] && !IsEmpty(buffer_line_down[i-1]))
{
phase = PHASE_BUY;
buffer_line_up[i] = band_lower;
buffer_line_up[i-1] = buffer_line_down[i-1];
}
if(phase!=PHASE_SELL && Close[i]buffer_line_up[i-1])
{
buffer_line_up[i] = band_lower;
}
else
{
buffer_line_up[i] = buffer_line_up[i-1];
}
}
if(phase==PHASE_SELL && ((TrendMode==0 && !IsEmpty(buffer_line_down[i-2])) || TrendMode==1) )
{
if(band_upperRef(Avg,-1),H,L)));
EW=Zig(RetroSuccessSecret,pr);
//{ Plot on price chart }
if (Option==0)
Plot(EW, "EW", ParamColor("Color", colorBrown), ParamStyle("Style", styleNoLabel|styleThick));
else
{
//{ Plot on own window }
Plot(EWbuy-EWsell, "EW2", ParamColor("Color", colorRed), ParamStyle("Style", styleNoLabel|styleThick));
}
//{ Buy/Sell Elliot Wave stuff }
EWbuy=TroughBars(EW,pr)==1;
EWsell=PeakBars(EW,pr)==1;
Plot(C,"",47,128+4);
PlotShapes(EWbuy*shapeUpArrow,5,0,L,-5);
PlotShapes(EWsell*shapeDownArrow,4,0,H,-5);
//-- Script End -------
_SECTION_END();

ZIG HI LO

/*
Zig-Hi-Zag-Lo

To use to plot the true Peak High and Trough Low
for study of chart pattern, to create trading system

Modified from http://trader.online.pl/MSZ/e-w-ZigZag_HiLo.html

By TohMz
*/
pr=Param("ZigZag change amount", 5, 0.1,100,0.1);

pk=PeakBars(H,pr)==0;
tr=TroughBars(L,pr)==0;

zzHi=Zig(H,pr);
zzLo=Zig(L,pr);
Avg=(zzHi+zzLo)/2;

x=IIf(pk,zzHi,IIf(tr,zzLo,IIf(Avg>Ref(Avg,-1),H,L)));
zzHiLo=Zig(x,pr);

Plot( zzHiLo, "", ParamColor("Color",colorRed), ParamStyle("Style"));

//-- Delete below, to allow attach to any price chart
_N(Title = StrFormat("{{NAME}}- {{INTERVAL}} {{DATE}} O= %g, H= %g, L= %g, C= %g (%.1f%%) V= " +WriteVal( V, 1.0 ) +"\n{{VALUES}}", O, H, L, C, SelectedValue( ROC( C, 1 )) ));
PriceStyle = GetPriceStyle();
PriceStyleOpt = ParamStyle("Style") | PriceStyle;

if (PriceStyle==styleCandle)
Plot( C, "", colorWhite, PriceStyleOpt);
else
Plot( C, "", IIf( Close >= Ref(C, -1), colorBlue, colorRed ), PriceStyleOpt);

_SECTION_BEGIN("Sup / Res Lines");
SRswitch = ParamToggle("Sup / Res Lines","On,Off");
CHLswitch = ParamToggle("Hi Low / Close","Hi Low,Close");
NoLines = Param("No of Lines",3,1,10,1);
Sen = Param("Sensitivity",5,1,100,1);

Rcolor=ParamColor( "Res Color", colorGreen );
Rstyle=ParamStyle( "Res Style", styleLine );

Scolor=ParamColor( "Sup Color", colorBrown );
Sstyle=ParamStyle( "Sup Style", styleLine );

y=0;
x=0;

for( i = 1; i < NoLines+1 ; i++ )
{
Y[i]=LastValue(Peak(IIf(CHLswitch,C,H),Sen,i));
x[i]=BarCount - 1 - LastValue(PeakBars(IIf(CHLswitch,C,H),Sen,i));
Line = LineArray( x[i], y[i], Null, y[i], 1 );
Plot( IIf(SRswitch,Null,Line), "", Rcolor, Rstyle );

Y[i]=LastValue(Trough(IIf(CHLswitch,C,L),Sen,i));
x[i]=BarCount - 1 - LastValue(TroughBars(IIf(CHLswitch,C,L),Sen,i));
Line = LineArray( x[i], y[i], Null, y[i], 1 );
Plot( IIf(SRswitch,Null,Line), "", Scolor, Sstyle );
}
_SECTION_END();

FVE

_SECTION_BEGIN("FVE INTRA");
Period = Param("FVE period", 22, 10, 80, 1 );

MF = C - (H+L)/2 + Avg - Ref( Avg, -1 );
Vc = IIf( MF > 0.003 * C, V,
IIf( MF < -0.003 * C, -V, 0 ) ); FVE = Sum( Vc, Period )/MA( V, Period )/Period * 100; Plot( FVE, "FVE", colorLime ); GraphXSpace = 3; Buy = Cross( FVE, -5 ) AND LinRegSlope( FVE, 35 ) > 0 AND
LinRegSlope( Close, 35 ) < 0;
Sell = LinRegSlope( FVE, 25 ) < 0 OR Ref( Buy, -50 );
_SECTION_END();

FVE

_SECTION_BEGIN("FVE INTRA");
Period = Param("FVE period", 22, 10, 80, 1 );

MF = C - (H+L)/2 + Avg - Ref( Avg, -1 );
Vc = IIf( MF > 0.003 * C, V,
IIf( MF < -0.003 * C, -V, 0 ) ); FVE = Sum( Vc, Period )/MA( V, Period )/Period * 100; Plot( FVE, "FVE", colorLime ); GraphXSpace = 3; Buy = Cross( FVE, -5 ) AND LinRegSlope( FVE, 35 ) > 0 AND
LinRegSlope( Close, 35 ) < 0;
Sell = LinRegSlope( FVE, 25 ) < 0 OR Ref( Buy, -50 );
_SECTION_END();

FVE

_SECTION_BEGIN("FVE INTRA");
Period = Param("FVE period", 22, 10, 80, 1 );

MF = C - (H+L)/2 + Avg - Ref( Avg, -1 );
Vc = IIf( MF > 0.003 * C, V,
IIf( MF < -0.003 * C, -V, 0 ) ); FVE = Sum( Vc, Period )/MA( V, Period )/Period * 100; Plot( FVE, "FVE", colorLime ); GraphXSpace = 3; Buy = Cross( FVE, -5 ) AND LinRegSlope( FVE, 35 ) > 0 AND
LinRegSlope( Close, 35 ) < 0;
Sell = LinRegSlope( FVE, 25 ) < 0 OR Ref( Buy, -50 );
_SECTION_END();

STOCH K CROSS STOCH D +- TREND LINE SHOW

_SECTION_BEGIN("stoch k cross stoch d +ve");
/*Slow Stochastic and Trendlines
for Indicator Builder,
by Dimitris Tsokakis*/
D1=14;
MaxGraph=8;
ST3=StochK(D1);
ST33=StochD(D1);
Graph0=ST3;
Graph1=ST33;
Title=Name()+" - %K="+WriteVal(st3,FORMAT=1.2)+", %D="+
WriteVal(ST33,FORMAT=1.2)+
WriteIf(Cross(st3,st33)," POSITIVE CROSS"," ")+
WriteIf(Cross(ST33,ST3)," NEGATIVE CROSS","");
x = Cum(1);
per = 0.1;
s1=st33;
s11=st33;
pS = TroughBars( s1, per, 1 ) == 0;
endt= LastValue(ValueWhen( pS, x, 1 ));
startt=LastValue(ValueWhen( pS, x, 2 ));
dtS =endt-startt;
endS = LastValue(ValueWhen( pS, s1, 1 ) );
startS = LastValue( ValueWhen( pS, s1, 2 ));
aS = (endS-startS)/dtS;
bS = endS;
trendlineS = aS * ( x -endt ) + bS;
Graph6 = IIf(x>startt-1 AND TRENDLINES>0 AND TRENDLINES<100,trendlineS,-1e10); Graph6Style = 1; Graph6Color = 1; pR = PeakBars( s11, per, 1 ) == 0; endt1= LastValue(ValueWhen( pR, x, 1 )); startt1=LastValue(ValueWhen( pR, x, 2 )); dtR =endt1-startt1; endR = LastValue(ValueWhen( pR, s11, 1 ) ); startR = LastValue( ValueWhen( pR, s11, 2 )); aR = (endR-startR)/dtR; bR = endR; trendlineR = aR * ( x -endt1 ) + bR; Graph7 = IIf(x>startT1-1 AND TRENDLINER>0 AND
TRENDLINER<100,trendlineR,-1e10);
Graph7Style = 1;
Graph7Color = 1;
_SECTION_END();

31 January 2012

Fibonacci Numbers

Overview
Fibonacci numbers are the result of work by Leonardo Fibonacci in the early 1200's while studying the Great Pyramid of Gizeh. The fibonacci series is a numerical sequence comprised of adding the previous numbers together, i.e.,

(1,2,3,5,8,13,21,34,55,89,144,233 etc..)

An interesting property of these numbers is that as the series proceeds, any given number is 1.618 times the preceding number and 0.618% of the next number.

(34/55 = 55/89 = 144/233 =0.618) (55/34 =89/55 =233/144 =1.618), and 1.618 =1/0.618.

This properties of the fibonacci series occur throughout nature, science and math and is the number 0.618 is often referred to as the "golden ratio" as it is the root of the following polynomial x^2+x-1=0 which can be rearranged to x= 1/(1+x).

So that's were the fib # 0.618 comes from. The other fibs 0.382 and 0.5 commonly used in technical analysis have a less impressive background but are just as powerful in Technical analysis.

0.382=(1-.618)=(0.618*0.618)

and 0.5 is the mean of the two numbers.

Other neat fib facts (0.618*(1+0.618)=1 and (0.382*(1+.618))=0.618.

Use of Fibonacci #'s in Technical Analysis
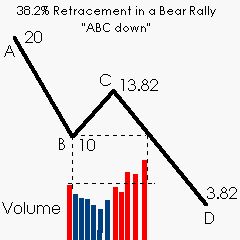
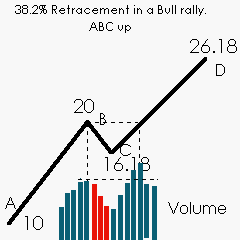
Fibonacci numbers are commonly used in Technical Analysis with or without a knowledge of Elliot wave analysis to determine potential support, resistance, and price objectives. 38.2% retracements usually imply that the prior trend will continue, 61.8% retracements imply a new trend is establishing itself. A 50% retracement implies indecision. 38.2% retracements are considered nautral retracements in a healthy trend.

ABC's
Price objectives for a natural retracement (38.2%) can be determined by adding (or subtracting in a downtrend) the magnitude of the previous trend to the 38.2% retracement. After the 38.2% retracement the stock should break through the previous swing point(B) on heavier volume. If the volume isn't there the magnitude of the move will usually be diminished, especially on very low volume.


A-B =C-D when B-C =38.2% of A-B

61.8% retracements are warning signs of a potential trend changes. For a more detailed explanation of Fibonacci price projections and price wave theory I highly recommend the Elliot Wave Principle links below.

Confluence Confluence occurs when you take fibonacci projections off of multiple trends and get the same number and strengthens when it corresponds with other technical advents such as gaps, swing high/lows, chart indicators crossovers (MACD, RSI, Stochastics, etc.), trading congestion, etc. The more confluence, the more significant the level. I really take notice when I get two or more fib #s (say a 38.2% and 61.8%) to correspond with a gap in the chart or a swing high. Confluence is very powerful as it combines multiple technical analysis techniques to arrive at the same conclusion, and should be relied on accordingly IMHO

Trading Strageties JMHO

Once a new swing point is established in an equity, a new set of fibonacci numbers should be calculated, and confluence checked to determine potential support/resistance levels and trading strategies. (let the Fibonacci Calculator do most of the work for you). For instance:


If a stock is trending up, one may watch it until it forms a top then calculate the fibs. If she retraces 38.2% and turns with confluence, one could bite with an automatic stop under the 50% retracement and objective of the ABC. The Risk/Reward ratio for that trade is 0.118. (If you got stopped out 8 times and hit once you would have a 5.6% profit).

If she's trending down, you could bite at the 38.2% bounce with a stop at the 50% and get the same risk/reward ratio. With both strategies it is critical for the volume to be heavier on the swing point breakout.

If a position is going with you and you're looking for an exit point, calculate the 38.2% fib once a top is clear and put a stop below it. Won't get you out at the top but you may not miss that monster rally either.

Think a stock is a dog but it's trading at it's high wait for a 61.8% retracement from the last trend and sell it, with the stop below the 50% retracement.

20 January 2012

Bob-Marley-The-Wailers-Get-Up-Stand-Up My favorite (inspirational Song)

Get up, stand up: stand up for your rights!
Get up, stand up: don't give up the fight!

Preacherman, don't tell me,
Heaven is under the earth.
I know you don't know
What life is really worth.
It's not all that glitters is gold;
'Alf the story has never been told:
So now you see the light, eh!
Stand up for your rights. Come on!

Get up, stand up: stand up for your rights!
Get up, stand up: don't give up the fight!
Get up, stand up: stand up for your rights!
Get up, stand up: don't give up the fight!

Most people think,
Great God will come from the skies,
Take away everything
And make everybody feel high.
But if you know what life is worth,
You will look for yours on earth:
And now you see the light,
You stand up for your rights. Jah!

Get up, stand up! (Jah, Jah!)
Stand up for your rights! (Oh-hoo!)
Get up, stand up! (Get up, stand up!)
Don't give up the fight! (Life is your right!)
Get up, stand up! (So we can't give up the fight!)
Stand up for your rights! (Lord, Lord!)
Get up, stand up! (Keep on struggling on!)
Don't give up the fight! (Yeah!)

We sick an' tired of-a your ism-skism game -
Dyin' 'n' goin' to heaven in-a Jesus' name, Lord.
We know when we understand:
Almighty God is a living man.
You can fool some people sometimes,
But you can't fool all the people all the time.
So now we see the light (What you gonna do?),
We gonna stand up for our rights! (Yeah, yeah, yeah!)

So you better:
Get up, stand up! (In the morning! Git it up!)
Stand up for your rights! (Stand up for our rights!)
Get up, stand up!
Don't give up the fight! (Don't give it up, don't give it up!)
Get up, stand up! (Get up, stand up!)
Stand up for your rights! (Get up, stand up!)
Get up, stand up! ( ... )
Don't give up the fight! (Get up, stand up!)
Get up, stand up! ( ... )
Stand up for your rights!
Get up, stand up!
Don't give up the fight! /fadeout/

The lyrics for this 1973 track were written by Bob Marley and Peter Tosh who were influenced mainly by their Jamaican upbringing. The song is basically about the fight for acceptance of their Rastafarian religion and the need to take action to avoid oppression, however, much of the inspiration appears to have come from another song `Slippin' Into Darkness' by War.

The meaning behind the lyrics can be interpreted as both religious and anti-religious depending on your point of view. On one hand, the line, `Get up, stand up: stand up for your rights,' can be seen as a rallying call to stand up and demand respect for the Rastafarian religion. On the other hand, the lines, `Preacher man don't tell me, heaven is under the earth, I know you don't know, what life is really worth,' suggest hanging on to freedom of thought rather than the words of religious leaders.

In the track by War, the lyrics warn of the thin line between sanity and insanity and how your own thoughts can be enough to push you over the edge into darkness. In this song, the lyrics tell us that religion can also be responsible for altering the way some people think with the lines, `Alf the story has never been told, so now you see the light, eh!'

There may well be some underlying political as well as social undertones but the main message in the lyrics is to live for the here and now; not to wait for the promised ever after.

14 January 2012

Buying Stocks When The Price Goes Down: Big Mistake?

The strategy of "averaging down", as the term implies, involves investing additional amounts in a financial instrument or asset if it declines significantly in price after the original investment is made. It's true that this action brings down the average cost of the instrument or asset, but will it lead to great returns or just to a larger share of a losing investment? Read on to find out.

Tutorial: The World's Greatest Investors

Conflicting Opinions
There is radical difference of opinion among investors and traders about the viability of the averaging down strategy. Proponents of the strategy view averaging down as a cost-effective approach to wealth accumulation; opponents view it as a recipe for disaster.

The strategy is often favored by investors who have a long-term investment horizon and a contrarian approach to investing. A contrarian approach refers to a style of investing that is against, or contrary, to the prevailing investment trend. (Learn how these investors profit from market fear in Buy When There's Blood In The Streets.)

For example, suppose that a long-term investor holds Widget Co. stock in his or her portfolio and believes that the outlook for Widget Co. is positive. This investor may be inclined to view a sharp decline in the stock as a buying opportunity, and probably also has the contrarian view that others are being unduly pessimistic about Widget Co.'s long-term prospects. Such investors justify their bargain-hunting by viewing a stock that has declined in price as being available at a discount to its intrinsic or fundamental value. "If you liked the stock at $50, you should love it at $40" is a mantra often quoted by these investors. (To learn about the downside to this strategy, read Value Traps: Bargain Hunters Beware!)

On the other side of the coin are the investors and traders who generally have shorter-term investment horizons and view a stock decline as a portent of things to come. These investors are also likely to espouse trading in the direction of the prevailing trend, rather than against it. They may view buying into a stock decline as akin to trying to "catch a falling knife." Such investors and traders are more likely to rely on technical indicators, such as price momentum, to justify their investing actions. Using the example of Widget Co., a short-term trader who initially bought the stock at $50 may have a stop-loss on this trade at $45. If the stock trades below $45, the trader will sell the position in Widget Co. and crystallize the loss. Short-term traders generally do not believe in averaging their positions down, as they see this as throwing good money after bad.

Advantages of Averaging Down
The main advantage of averaging down is that an investor can bring down the average cost of a stock holding quite substantially. Assuming the stock turns around, this ensures a lower breakeven point for the stock position, and higher gains in dollar terms than would have been the case if the position was not averaged down.

In the previous example of Widget Co., by averaging down through the purchase of an additional 100 shares at $40, the investor brings down the breakeven point (or average price) of the position to $45. If Widget Co. stock trades at $49 in another six months, the investor now has a potential gain of $800 (despite the fact that the stock is still trading below the initial entry price of $50).

If Widget Co. continues to rise and advances to $55, the potential gains would be $2,000. By averaging down, the investor has effectively "doubled up" the Widget Co. position. Had the investor not averaged down when the stock declined to $40, the potential gain on the position (when the stock is at $55) would amount to only $500.

Disadvantages of Averaging Down
Averaging down or doubling up works well when the stock eventually rebounds because it has the effect of magnifying gains, but if the stock continues to decline, losses are also magnified. In such cases, the investor may rue the decision to average down rather than either exiting the position or failing to add to the initial holding.

Investors must therefore take the utmost care to correctly assess the risk profile of the stock being averaged down. While this is no easy feat at the best of times, it becomes an even more difficult task during frenzied bear markets such as that of 2008, when household names such as Fannie Mae, Freddie Mac, AIG and Lehman Brothers lost most of their market capitalization in a matter of months. (To learn more, read Fannie Mae, Freddie Mac And The Credit Crisis Of 2008.)

Another drawback of averaging down is that it may result in a higher-than-desired weighting of a stock or sector in an investment portfolio. As an example, consider the case of an investor who had a 25% weighting of U.S. bank stocks in a portfolio at the beginning of 2008. If the investor averaged down his or her bank holdings after the precipitous decline in most bank stocks that year so that these stocks made up 35% of the investor's total portfolio, this proportion may represent a higher degree of exposure to bank stocks than that desired. At any rate, it certainly puts the investor at much higher risk. (To learn more, read A Guide To Portfolio Construction.)

Practical Applications
Some of the world's most astute investors, including Warren Buffett, have successfully used the averaging down strategy over the years. While the pockets of the average investor are nowhere near as deep as deep as Buffett's, averaging down can still be a viable strategy, albeit with a few caveats:

Averaging down should be done on a selective basis for specific stocks, rather than as a catch-all strategy for every stock in a portfolio. This strategy is best restricted to high-quality, blue-chip stocks where the risk of corporate bankruptcy is low. Blue chips that satisfy stringent criteria - which include a long-term track record, strong competitive position, very low or no debt, stable business, solid cash flows, and sound management - may be suitable candidates for averaging down.

Before averaging down a position, the company's fundamentals should be thoroughly assessed. The investor should ascertain whether a significant decline in a stock is only a temporary phenomenon, or a symptom of a deeper malaise. At a minimum, factors that need to be assessed are the company's competitive position, long-term earnings outlook, business stability and capital structure.

The strategy may be particularly suited to times when there is an inordinate amount of fear and panic in the markets, because panic liquidation may result in high-quality stocks becoming available at compelling valuations. For example, some of the biggest technology stocks were trading at bargain-basement levels in the summer of 2002, while U.S. and international bank stocks were on sale in the second half of 2008. The key, of course, is exercising prudent judgment in picking the stocks that are best positioned to survive the shakeout.

The Bottom Line
Averaging down is a viable investment strategy for stocks, mutual funds and exchange-traded funds. However, due care must be exercised in deciding which positions to average down. The strategy is best restricted to blue chips that satisfy stringent selection criteria such as a long-term track record, minimal debt and solid cash flows.
by Elvis Picardo

Read more: http://www.investopedia.com/articles/stocks/08/average-down-dollar-cost-average.asp#ixzz1jQZn1yyW

13 January 2012

COG CHART

AFL COG

http://www.4shared.com/file/OCJoOub6/COG_MOD_SELF.html


COG: Center of Gravity indicator
AFL code by E.M.Pottasch, 2011
translated from: http://chartstudio.whselfinvest.com/files/CenterGravity_0.ctl

another translation of COG. This code faster and also comes with a timer which I will post separately.

About how to use it: there is material on the internet that explains. Note that this indicator repaints. Each time a new data point come in it uses all datapoints in the range to calculate the polynomial fit. So the fit is not stationary. Therefor it looks great but its use in trading is questionable. The chart shows how it is intended to use: The bands are heading up and the price is starting to enter the green zone this is where you buy.
Center of Gravity (COG) indicator, original idea from El Mostafa Belkhayate
Amibroker AFL code by E.M.Pottasch, 2011
Based on code by Fred Tonetti, 2006, n-th order Polynomial fit (see Amibroker Lib)
JohnCW provided Gaussian_Eliminationsv function based on static variables.

COG timing indicator
AFL translation by E.M.Pottasch, 2011
from: http://chartstudio.whselfinvest.com/files/COGTiming.ctl

I cant code just tricks n tweeks(copy past)

Inspired by wisestock n Rakib Bro

LINKS

http://www.imdb.com/title/tt1439572/
http://www.vyingbrain.com/
http://www.amibroker.com/library/list.php
http://blog.bdnews24.com/nijhum/58900
http://www.blogtopsites.com/siteposts/60116
http://www.simple-stock-trading.com/
http://www.amibroker.com/guide/drawtools.html
http://www.liberatedstocktrader.com/pareto-fibonacci-stock-market-crashes-stock-market-video-podcast-sept-2011/
http://www.swing-trade-stocks.com/technical-analysis-videos.html
http://www.stockta.com/fibonacci.html
http://www.youtube.com/watch?v=Dlv4MKIxdOg

http://www.desipad.com/english-hollywood-movies/

http://www.desirulez.net/latest-exclusive-movie-hq/
http://www.stockta.com/fibonacci.html


Website Links

http://www.stockta.com/fibonacci.html


09 January 2012

INTRA BP SP

_SECTION_BEGIN("Demand Index");
//------------------------------------------------------------------------------
//
// Formula Name: Demand Index
// Author/Uploader: Steve Wiser
// E-mail: slwiserr@erols.com
// Date/Time Added: 2001-07-05 19:12:36
// Origin:
// Keywords:
// Level: medium
// Flags: system,exploration,indicator
// Formula URL: http://www.amibroker.com/library/formula.php?id=58
// Details URL: http://www.amibroker.com/library/detail.php?id=58
//
//------------------------------------------------------------------------------
//
// Uses the demand index for a system test.
//
//------------------------------------------------------------------------------

/* Demand Index */
/* Steve Wiser at slwiserr@erols.com */
/* Exploration, System and indicator */

GraphMax=9;

A=(H+L+2*C);
B=EMA((HHV(H,2)-LLV(L,2)),19);
BuyP=
/*{BuyPower}*/
V/EMA(V,19) * ((A>=Ref(A,-1)) +(ARef(A,-1)) / exp((0.375 * (A+Ref(A,-1)) / B ) * (A-Ref(A,-1)) / Ref(A,-1)));


mabp=EMA(BuyP,19);
masp=EMA(SellP,19); /*{smooth Selling Pressure}*/
divsor=IIf(mabp>masp,mabp,masp); /*{BP:SP ratio}*/
divend=IIf(mabpmabp) , -var2 , var2 ) ; /*{range -100 to 100}*/
var4=var3*100;
Graph1 = var4;
Graph1Style=5;

var5=MA(var4,30);
Graph2=var5;;
Graph2Style=5;
Graph2Color=7;

/* Zero Line */
Graph0=0;


Buy=Cross(var4,var5); /* originally var5 was a zero */
Sell=Cross(0,var4);

Buy=ExRem(Buy,Sell);
Sell=ExRem(Sell,Buy);

Short=Sell;
Cover=Buy;

Filter= (Buy == 1 OR Sell == 1) ;
NumColumns = 7;
Column0 = IIf(Buy == 1, 1, IIf(Sell == 1, -1, 0 ) );
Column0Format = 1.0;
Column0Name = "B/S";
Column1 = C;
Column1Name = "Close ";
Column1Format = 1.2;
Column2 = MA(V,17);
Column2Name = "17 Ma Vol ";
Column2Format = 1.0;
Column3 = MA(C,17)/MA(C,50);
Column3Name = "% 17/50 ";
Column3Format = 1.2;
Column4= MA(C,17);
Column4Name="17 C ma";
Column4Format = 1.2;
Column4= MA(C,50);
Column4Name="50 C ma";
Column4Format = 1.2;
Column5=ROC(var4,2);
Column5Name="ROC DI";
Column5Format=1.2;
Column6=Cum(1);
Column6Name = "#Bars";
Column6Format = 1.0;

/* End of Exploration Code. */
_SECTION_END();

08 January 2012

FIBO RETS EXTEN COMENTRY NICE AFL

_SECTION_BEGIN("MOB simulation shiree");

SetChartOptions(0,chartShowArrows|chartShowDates);


_N(Title = StrFormat("{{NAME}} - {{INTERVAL}} {{DATE}} Open %g, Hi %g, Lo %g, Close %g (%.1f%%) {{VALUES}}", O, H, L, C, SelectedValue( ROC( C, 1 ) ) ));
//Plot( C, "Close", ParamColor("Color", colorPink ), styleNoTitle | ParamStyle("Style") | GetPriceStyle() );
PlotOHLC(O,H,L,C,"Price",IIf(C>O,colorGreen,colorRed),styleCandle);


//Date: 12-January 2002 by Thomas Zmuck
//thomas.zm@ aon.at
Offset = 5; //use two sheets: one with 5 and another with 7, or maybe other offset value
Avgmov = Offset*MA(abs( ROC(C,1)) ,20);
per = LastValue(Avgmov) ;
x=Cum(1);
Range = 0.01;
PS = TroughBars(L, per,1) == 0;
xa = LastValue(ValueWhen (PS,x,1)) ;//x from last trough
Ya = LastValue(ValueWhen (PS,L,1)) ;//y (Low) last trough
PR = PeakBars(H,per, 1) == 0;
xb = LastValue(ValueWhen (PR,x,1)) ;//x from last peak
Yb = LastValue(ValueWhen (PR,H,1)) ;//y (High) last peak
Trough_ReTest = abs((L/ya)-1) xa;//upSwing
DN = xa>xb;//DownSwing
RT23_6 = IIf(UP,yb-(yb- ya)*0.236, IIf(DN,ya+ (yb-ya)*0.236,-1e10) );
RT38_2 = IIf(UP,yb-(yb- ya)*0.382, IIf(DN,ya+ (yb-ya)*0.382,-1e10) );
RT50_0 = IIf(UP,yb-(yb- ya)*0.500, IIf(DN,ya+ (yb-ya)*0.500,-1e10) );
RT61_8 = IIf(UP,yb-(yb- ya)*0.618, IIf(DN,ya+ (yb-ya)*0.618,-1e10) );
RT78_6 = IIf(UP,yb-(yb- ya)*0.786, IIf(DN,ya+ (yb-ya)*0.786,-1e10) );

RT12_7 = IIf(UP,yb-(yb- ya)*1.27, IIf(DN,ya+ (yb-ya)*1.27,-1e10) );
RT16_1 = IIf(UP,yb-(yb- ya)*1.61, IIf(DN,ya+ (yb-ya)*1.61,-1e10) );

RT=
IIf(UP,-100* (yb-L)/(yb- ya),
100*(H-ya)/( yb-ya));//Retracement_ Value
InZone = Cya;//use it for filter to receive only signals that are in in the Retracement zone.
Buy = Trough_ReTest OR peak_Cross;
Sell = Peak_ReTest OR trough_Cross;
Filter = 1;
AddColumn(RT, "RT%");
AddColumn(Trough_ReTest,"TR- Test",1.0) ;
AddColumn(Peak_ReTest,"PK-Test",1.0) ;
AddColumn(Trough_Cross,"TR-Cross",1.0);
AddColumn(Peak_Cross,"PK-Cross",1.0);
//AddColumn(CdDoji( )OR CHammer(),"Candle" ,1.0);
Plot(C,"C",1, 64);
Plot(IIf(x>xa, ya,-1e10) ,"Bottom" ,colorBrown, 1+8);
Plot(IIf(x>xb, yb,-1e10) ,"Top",colorBrown,1+8);
xab = IIf(xb>xa,xb, xa);
//Retracements
Plot(IIf(x>= xab+1,RT23_6,-1e10), "23,6% Retr.",5,1);
Plot(IIf(x>= xab+1,RT38_2,-1e10), "38,2% Retr.",5,1);
Plot(IIf(x>= xab+1,RT50_0,-1e10), "50,0% Retr.",colorBlue, 1);
Plot(IIf(x>= xab+1,RT61_8,-1e10), "61,8% Retr.",colorYellow, 1);
Plot(IIf(x>= xab+1,RT78_6,-1e10), "78,6% Retr.",colorYellow, 1);

Plot(IIf(x>= xab+1,RT12_7,-1e10), "127% ext.",colorBrightGreen, styleDots);
Plot(IIf(x>= xab+1,RT16_1,-1e10), "161% ext.",colorBrightGreen, styleDots);
CondA=IIf(x>= xab+1,RT12_7,-1e10);
CondB=IIf(x>= xab+1,RT16_1,-1e10);
PlotOHLC(Condb,Condb,Conda,Conda,"",ColorRGB(30,130,30),styleCloud,styleNoLabel);


GraphXSpace = 0.5;


//Plot(Gauss2ord(C,5),"M5",4,1);
//GraphXSpace = 1.5;
//Title = Name()+" per = "+WriteVal(per, 1.0) +" Close = "+WriteVal(C, 1.2)+ " ("+WriteVal( ROC(C,1), 1.2)+"%)" +" Current Correction = "+WriteVal(RT, 1.0)+"%";

//Plot( Volume,"V", ParamColor("Color", colorBlueGrey ), ParamStyle( "Style", stylehidden| styleOwnScale | styleThick, maskHistogram ), 2 );


_SECTION_END( );

07 January 2012

SIMPLE MA CROSSOVER AFL SCAN

// EnterAtMarket.afl
//
// Entry at the Market
//
// This example uses a simple moving average crossover to
// illustrate entering a long position at the market
//
// The delay between the signal and the entry is
// controlled either by the Settings window or the AFL code
//
// The following code will insure that trades will be made
// on the Close of the same bar that generates the Buy or
// Sell signal.
SetTradeDelays(0,0,0,0);
BuyPrice = C;
SellPrice = C;

// The trading system is a simple moving average crossover
MA1 = MA(C,5);
MA2 = MA(C,25);

// The Buy signal is generated on the bar when MA1 crosses
// from below MA2 to above MA2.
Buy = Cross(MA1,MA2);
Sell = Cross(MA2,MA1);
//Figure 7.1 Enter at Market

MODIFY PERAMITER AS SUITABLE

Stock Scanning /Shortlisting

You can scan based on a variety of parameters.

Period – the last n bars that you want to scan Rate of change for 3 groups of n bars in the period above. If ROC is made 0, no rate of change is compared for that period. The AFL selects both positive ROC combinations and the converse. For example if you choose a ROC combination of 0.2, 0.2 and 0.2 for 10 bars, the selection of minus .2, minus .2, and minus .2 is automatic.

Use exploration to view the results. In exploration you can also sort by Price change during the day or within the range of n bars.

You can choose appropriate time frames and stocks lists using the Settings and Define options in Automatic Analysis.

Go ahead and modify to suit your needs.


n =Param("Period", 6, 1, 50, 1 );
n1 = Param("ROC1", 0.2, -2, 3, 0.01);
n2 = Param("ROC2", 0, -2, 3, 0.01);
n3 = Param("ROC3", 0, -2, 3, 0.01);


//Cond1 = IIf((C-Ref(C,-1))/Ref(C,-1)> 0.01 AND C>EMA(C,10),1,0);
//Cond2 = IIf((Ref(C,-1)-C)/Ref(C,-1)> 0.01 AND C0 AND n2>0 AND n3>0)
{
Cond1= ROC1 > n1 AND ROC2 > n2 AND ROC3 > n3;
Cond2= ROC1 < -n1 AND ROC2 < -n2 AND ROC3 < -n3; } else if(n1>0 AND n2>0 AND n3==0)
{
Cond1= ROC1 > n1 AND ROC2 > n2 ;
Cond2= ROC1 < -n1 AND ROC2 < -n2 ; } else if(n1>0 AND n2==0 AND n3==0)
{
Cond1= ROC1 > n1 ;
Cond2= ROC1 < -n1 ; } else if(n1>0 AND n2==0 AND n3>0)
{
Cond1= ROC1 > n1 AND ROC3 > n3;
Cond2= ROC1 < -n1 AND ROC3 < -n3; } else if(n1==0 AND n2>0 AND n3>0)
{
Cond1= ROC2 > n2 AND ROC3 > n3;
Cond2= ROC2 < -n2 AND ROC3 < -n3; } else if(n1==0 AND n2>0 AND n3==0)
{
Cond1= ROC2 > n2 ;
Cond2= ROC2 < -n2; } else if(n1==0 AND n2==0 AND n3>0)
{
Cond1= ROC3 > n2 ;
Cond2= ROC3 < -n2; } else if(n1==0 AND n2==0 AND n3==0) { Cond1= 1; Cond2= 1; } else if(n1>0 AND n2<0 AND n3==0) { Cond1= ROC1 > n1 AND ROC2 < n2 ; Cond2= ROC1 < -n1 AND ROC2 > -n2 ;
}
else if(n1<0 AND n2>0 AND n3<0) { Cond1= ROC1 < n1 AND ROC2 > n2 AND ROC3 < n3; Cond2= ROC1 > -n1 AND ROC2 < -n2 AND ROC3 > n3;
}
else if(n1<0 AND n2>0 AND n3>0)
{
Cond1= ROC1 < n1 AND ROC2 > n2 AND ROC3 > n3;
Cond2= ROC1 > -n1 AND ROC2 < -n2 AND ROC3 < n3; } else if(n1<0 AND n2>0 AND n3==0)
{
Cond1= ROC1 < n1 AND ROC2 > n2 ;
Cond2= ROC1 > -n1 AND ROC2 < -n2 ; } else if(n1<0 AND n2==0 AND n3>0)
{
Cond1= ROC1 < n1 AND ROC3 > n3;
Cond2= ROC1 > -n1 AND ROC3 < n3; } prch = (C- TimeFrameGetPrice( "C", inDaily, -1 ))/ TimeFrameGetPrice( "C", inDaily, -1 )*100 ; prch6= (C-Ref(C,-6))/Ref(C,-6)*100; Perc = (C-Ref(C,-nn))/Ref(C,-nn); Buy=Cond1 OR Cond2; Sell=!cond1 AND !cond2; Filter = (Cond1 OR Cond2) AND ADX() > 16;// AND C < 2500 ;
AddColumn(Cond1, "Buy",1);
AddColumn(Cond2, "Sell", 1);
AddColumn(C, "Close", 1.3);
AddColumn(Perc, "Change", 1.3);
AddColumn(ADX(),"ADX",1.1);
AddColumn(ROC1, "ROC", 1.1);
AddColumn(ROC2,"ROC-",1.1);
AddColumn(ROC3,"ROC--",1.1);
AddColumn(prch,"prchopen", 1.2);
AddColumn(prch6,"prchlast6", 1.2);


This scan helps to identify stocks which have a trend developing.
For example if your database has stock futures, you can find out which of these stocks are trending positively or negatively. The scan allows you to examine “n” bars, which you can set up in the parameters section – the default is 6. The default rate of change is +0.2 and -0.2.

By default the scan will examine the ROC of price movement for the latest n (default =6) bars for the time frame that you set in Automatic Analysis (which could be 5 minutes, 15 minutes, daily etc).

The output in the scan window will be all those stocks which have an ROC in the last n (default=6) greater than 0.2 or less than -0.2. This will allow you to identify positive trending and negative trending stocks.

The parameters can be changed using the parameters section in the Automatic Analysis window.

By default only the latest n (6) bars are selected in the scan. You can change this also by giving non zero values to ROC2, and ROC3. Lets say these are also set to 0.2 and 0.2. In that case, the scan will result in stocks which meet the criteria – where the the latest n bars, the previous n bars and the ones n bars prior as well to meet the ROC condition that you have setup.

For example if ROC1=ROC2=ROC3 =0.2, and n =6. The scan will show those stocks where the ROC in the three sets of previous 6 bars,(-1 to -6, -7 to -12 and -13 to -18) all have rates of change greater than 0.2 or less than -0.2.

Excellent to identify big trending stocks.

If you experiment with different positive and negative values of ROC1/2/3, you will also be able to identify stocks swinging one direction to the other.

And best part, of course, ability to set any time frame.

The scanned stocks can be put into a new watch list that you can then easily track.

Hope this helps.

06 January 2012

Remember it

Walking away from a loss market is a very hard thing to do but hanging around at a falling market is the biggest sin of all-- Marcus Padley

DSE EOD DOWNLOAD

aLL credit to original uploader.
https://skydrive.live.com/?cid=a8c03527a45e2b75&sc=documents&id=A8C03527A45E2B75!296

DSE bull

This software is collected from rubels blog and all credit goes to him.This really cool.

http://jaywalkable.wordpress.com/dse-bull/

01 January 2012

Linear Regression Channel with Trend Identifier for Amibroker (AFL)

I modified the original Linear Regression code so that the line will change color based on the degree of the Linear Regression slope. I combine this with my trading system. When my system gives an entry signal I look at the Linear Regression Line and I will only take long positions if the Linear Regression line is green and the entry price is below the LR line. When my system gives an entry signal I look at the Linear Regression Line and I will only take short positions if the Linear Regression line is red and the entry price is above the LR line. It is usefull for filtering out lower probability trades.

I prefer 89 period .

28 December 2011

United Nations: TIPAIMUKH DAM MUST BE STOPPED

http://www.change.org/petitions/united-nations-tipaimukh-dam-must-be-stopped?share_id=GmiIniXjov


শুধু ২ টা মিনিট সময় চাচ্ছি আপনার কাছে। দেশের জন্য ২ টা মিনিট সময় দিবেন কি ?

টিপাইমুখ বন্ধে জাতিসংঘের হস্তক্ষেপের জন্য দরকার ১ লক্ষ সাইন। আর সাইন করতে হবে আমাদের। আসুন, ২ মিনিট সময় ব্যয় করি দেশের জন্য। এই লিঙ্কে যান ~ http://chn.ge/sSklHz

First Name, Last Name, Email, Address, City এই ঘরগুলো পূরণ করুন। State ঘরে পাশে Outside U.S. এ ক্লিক করুন। দেখবেন State শব্দটি পরিবর্তিত হয়ে Country হয়েছে। এইবার সেখান থেকে Bangladesh সিলেক্ট করুন। Post Code এ আপনার এলাকার পোস্ট কোড দিন। যারা পোস্ট কোড জানেন না তারা ঢাকার পোস্ট কোড ১০০০ দিয়ে ঘরটি পূরণ করুন। তারপর Sign এ ক্লিক করে পিটিশনে সাইন শেষ করুন।

পোষ্ট কোড জানা না থাকলে নিচের লিংকে দেখুনঃ
ঢাকা বিভাগঃ http://bitly.com/rCGwNe
চট্টগ্রাম বিভাগঃ http://bitly.com/scBcDG
খুলনা বিভাগঃ http://bitly.com/v8j8rf
সিলেট বিভাগঃ http://bitly.com/sda4fp
বরিশাল বিভাগঃ http://bitly.com/rX8NlO
রাজশাহী ও রংপুর বিভাগঃ http://bitly.com/ulxLOh

অনেক ব্লগার আছেন এই পেইজে। তাদের অনুরোধ করব এই লেখাটি ব্লগে প্রকাশ করুন। অনেক পেইজের এডমিন আছেন তাদের অনুরোধ করব লেখাটি শেয়ার করুন। আমাদের কোনো ক্রেডিট দেওয়া লাগবে না, দেশের জন্য কাজ করছি, নিজের নাম কমানোর জন্য নয়। যারা এই লেখাটি পড়ছেন তারা এই লেখাটিকে শেয়ার করুন। যত সম্ভব লেখাটিকে ছড়িয়ে দিন।

দেশের জন্য ২ টা মিনিট সময় দিন, আর কিছু না হোক অন্তত নিজের বিবেকের কাছে স্বচ্ছ থাকবেন।

TA LINKS

http://www.investopedia.com/articles/technical/04/042804.asp#axzz1gy2Xe7UO

http://www.tradewithme.me/technical-analysis.html

21 December 2011

babylon tool bar remove / uninstal

babylon tool bar disgusting..suck..shit..

Manual Removal Guide for Babylon.Toolbar

The following instructions have been created to help you to get rid of "Babylon.Toolbar" manually.
Use this guide at your own risk; software should usually be better suited to remove malware, since it is able to look deeper.

If this guide was helpful to you, please consider donating towards this site.

Threat Details:

Categories:

* adware

Description:

Babylon Toolbar is a useless toolbar that gets installed by other software, for instance FoxTab Videoconverter. Legal age for installation is 18 while this fact is only mentioned in the terms.
Babylon Toolbar installs itself to the system, the Internet Explorer, Firefox and Google Chrome. The Babylon.Toolbar is almost identical to Toolbar.Facemood.

Removal Instructions:

Autorun:

Please use Spybot-S&D, RunAlyzer or msconfig.exe to remove the following autorun entries.

* Entries named "BabylonToolbar" and pointing to "?<$PROGRAMFILES>\BabylonToolbar\BabylonToolbar\*\BabylonToolbarsrv.exe? /md I".

Installed Software List:

You can try to uninstall products with the names listed below; for items identified by other properties or to avoid malware getting active again on uninstallation, use Spybot-S&D or RunAlyzer to locate and get rid of these entries.

* Products that have a key or property named "BabylonToolbar".

Files:

Please use Windows Explorer or another file manager of your choice to locate and delete these files.

* The file at "<$PROGRAMFILES>\Mozilla Firefox\searchplugins\babylon.xml".

Make sure you set your file manager to display hidden and system files. If Babylon.Toolbar uses rootkit technologies, use our RootAlyzer or our Total Commander anti-rootkit plugins.
You will have to use a global search for files without a name specified. Be extra careful, because just the name might not be enough to identify files!

Important: There are more files that cannot be safely described in simple words. Please use Spybot-S&D to remove them.

Folders:

Please use Windows Explorer or another file manager of your choice to locate and delete these folders.

* The directory at "<$APPDATA>\BabylonToolbar\BabylonToolbar".
* The directory at "<$APPDATA>\BabylonToolbar".
* The directory at "<$PROGRAMFILES>\BabylonToolbar\BabylonToolbar".
* The directory at "<$PROGRAMFILES>\BabylonToolbar".

Make sure you set your file manager to display hidden and system files. If Babylon.Toolbar uses rootkit technologies, use our RootAlyzer or our Total Commander anti-rootkit plugins.
You will have to use a global search for files without a name specified. Be extra careful, because just the name might not be enough to identify folders!

Important: There are more files that cannot be safely described in simple words. Please use Spybot-S&D to remove them.

Registry:

You can use regedit.exe (included in Windows) to locate and delete these registry entries.

* A key in HKEY_CLASSES_ROOT\ named "Babylon.dskBnd.*", plus associated values.
* A key in HKEY_CLASSES_ROOT\ named "Babylon.dskBnd", plus associated values.
* A key in HKEY_CLASSES_ROOT\ named "bbylnApp.appCore.*", plus associated values.
* A key in HKEY_CLASSES_ROOT\ named "bbylnApp.appCore", plus associated values.
* A key in HKEY_CLASSES_ROOT\ named "bbylntlbr.bbylntlbrHlpr.*", plus associated values.
* A key in HKEY_CLASSES_ROOT\ named "bbylntlbr.bbylntlbrHlpr", plus associated values.
* A key in HKEY_CLASSES_ROOT\ named "bbylntlbr.xtrnl.*", plus associated values.
* A key in HKEY_CLASSES_ROOT\ named "bbylntlbr.xtrnl", plus associated values.
* A key in HKEY_CLASSES_ROOT\ named "escort.escortIEPane.*", plus associated values.
* A key in HKEY_CLASSES_ROOT\ named "escort.escortIEPane", plus associated values.
* A key in HKEY_CLASSES_ROOT\ named "escort.escrtBtn.*", plus associated values.
* A key in HKEY_CLASSES_ROOT\ named "esrv.BabylonESrvc.*", plus associated values.
* A key in HKEY_CLASSES_ROOT\ named "esrv.BabylonESrvc", plus associated values.
* Delete the registry key "{09C554C3-109B-483C-A06B-F14172F1A947}" at "HKEY_CLASSES_ROOT\TypeLib\".
* Delete the registry key "{2EECD738-5844-4a99-B4B6-146BF802613B}" at "HKEY_CLASSES_ROOT\CLSID\".
* Delete the registry key "{2EECD738-5844-4a99-B4B6-146BF802613B}" at "HKEY_LOCAL_MACHINE\SOFTWARE\Microsoft\Windows\CurrentVersion\Explorer\Browser Helper Objects\".
* Delete the registry key "{3718D0AF-A3B8-4F5E-86F3-FAD8D02043BE}" at "HKEY_CLASSES_ROOT\Interface\".
* Delete the registry key "{4E1E9D45-8BF9-4139-915C-9F83CC3D5921}" at "HKEY_CLASSES_ROOT\TypeLib\".
* Delete the registry key "{6E8BF012-2C85-4834-B10A-1B31AF173D70}" at "HKEY_CLASSES_ROOT\TypeLib\".
* Delete the registry key "{706D4A4B-184A-4434-B331-296B07493D2D}" at "HKEY_CLASSES_ROOT\Interface\".
* Delete the registry key "{78868069-5D96-4B47-BE52-3D625EE3D7CB}" at "HKEY_CLASSES_ROOT\Interface\".
* Delete the registry key "{78888F8B-D5E4-43CE-89F5-C8C18223AF64}" at "HKEY_CLASSES_ROOT\Interface\".
* Delete the registry key "{8B8558F6-DC26-4F39-8417-34B8934AA459}" at "HKEY_CLASSES_ROOT\Interface\".
* Delete the registry key "{94C0B25D-3359-4B10-B227-F96A77DB773F}" at "HKEY_CLASSES_ROOT\Interface\".
* Delete the registry key "{98889811-442D-49dd-99D7-DC866BE87DBC}" at "HKEY_CLASSES_ROOT\CLSID\".
* Delete the registry key "{9E393F82-2644-4AB6-B994-1AD39D6C59EE}" at "HKEY_CLASSES_ROOT\Interface\".
* Delete the registry key "{A3A2A5C0-1306-4D1A-A093-9CECA4230002}" at "HKEY_CLASSES_ROOT\Interface\".
* Delete the registry key "{AD25754E-D76C-42B3-A335-2F81478B722F}" at "HKEY_CLASSES_ROOT\AppID\".
* Delete the registry key "{AD25754E-D76C-42B3-A335-2F81478B722F}" at "HKEY_CLASSES_ROOT\TypeLib\".
* Delete the registry key "{B0B75FBA-7288-4FD3-A9EB-7EE27FA65599}" at "HKEY_CLASSES_ROOT\Interface\".
* Delete the registry key "{B12E99ED-69BD-437C-86BE-C862B9E5444D}" at "HKEY_CLASSES_ROOT\TypeLib\".
* Delete the registry key "{B173667F-8395-4317-8DD6-45AD1FE00047}" at "HKEY_CLASSES_ROOT\Interface\".
* Delete the registry key "{B8276A94-891D-453C-9FF3-715C042A2575}" at "HKEY_CLASSES_ROOT\CLSID\".
* Delete the registry key "{BDB69379-802F-4eaf-B541-F8DE92DD98DB}" at "HKEY_CLASSES_ROOT\AppID\".
* Delete the registry key "{BFE569F7-646C-4512-969B-9BE3E580D393}" at "HKEY_CLASSES_ROOT\Interface\".
* Delete the registry key "{C2434722-5C85-4CA0-BA69-1B67E7AB3D68}" at "HKEY_CLASSES_ROOT\Interface\".
* Delete the registry key "{C2996524-2187-441F-A398-CD6CB6B3D020}" at "HKEY_CLASSES_ROOT\Interface\".
* Delete the registry key "{C8D424EF-CB21-49A0-8659-476FBAB0F8E8}" at "HKEY_CLASSES_ROOT\Interface\".
* Delete the registry key "{D7EE8177-D51E-4F89-92B6-83EA2EC40800}" at "HKEY_CLASSES_ROOT\TypeLib\".
* Delete the registry key "{E047E227-5342-4D94-80F7-CFB154BF55BD}" at "HKEY_CLASSES_ROOT\Interface\".
* Delete the registry key "{E3F79BE9-24D4-4F4D-8C13-DF2C9899F82E}" at "HKEY_CLASSES_ROOT\Interface\".
* Delete the registry key "{E46C8196-B634-44a1-AF6E-957C64278AB1}" at "HKEY_CLASSES_ROOT\CLSID\".
* Delete the registry key "{E77EEF95-3E83-4BB8-9C0D-4A5163774997}" at "HKEY_CLASSES_ROOT\Interface\".
* Delete the registry key "{FFB9ADCB-8C79-4C29-81D3-74D46A93D370}" at "HKEY_CLASSES_ROOT\CLSID\".
* Delete the registry key "BabylonToolbar" at "HKEY_CURRENT_USER\Software\".
* Delete the registry key "BabylonToolbar" at "HKEY_LOCAL_MACHINE\SOFTWARE\".
* Delete the registry key "dhkplhfnhceodhffomolpfigojocbpcb" at "HKEY_LOCAL_MACHINE\SOFTWARE\Google\chrome\Extensions\".
* Delete the registry key "escort.DLL" at "HKEY_CLASSES_ROOT\AppID\".
* Delete the registry key "esrv.EXE" at "HKEY_CLASSES_ROOT\AppID\".
* Delete the registry value "{98889811-442D-49dd-99D7-DC866BE87DBC}" at "HKEY_LOCAL_MACHINE\SOFTWARE\Microsoft\Internet Explorer\Toolbar\".

If Babylon.Toolbar uses rootkit technologies, use our RegAlyzer, RootAlyzer or our Total Commander anti-rootkit plugins.

Browser:

The following browser plugins or items can either be removed directly in your browser, or through the help of e.g. Spybot-S&D or RunAlyzer.

* Please check your bookmarks for links to "search.babylon.com".

Final Words:

If neither Spybot-S&D nor self help did resolve the issue or you would prefer one on one help,

1. Please read these instructions before requesting assistance,
2. Then start your own thread in the Malware Removal Forum where a volunteer analyst will advise you as soon as available.

Friday is offline Reply With Quote

19 December 2011

certificate format sample

http://www.scribd.com/doc/12639295/Salary-Certificate

http://www.citehr.com/224707-salary-certificate-formate.html#post1009693

19 November 2011

ড.আতিউর রহমান : রাখাল থেকে বাংলাদেশ ব্যাংকের গভর্নর

জাহিদ ইকবাল,নিউজ এজেন্সি টোয়েন্টিফোর,ঢাকা - দেশবরেণ্য অর্থনীতিবিদ ও বাংলাদেশ ব্যাংকের গভর্ণর ড.আতিউর রহমানের ছেলেবেলা কেটেছে গরু-ছাগল চড়িয়ে! সেখান থেকে আজকের অবস্থানে পৌছাতে তাঁকে অনেক ত্যাগ স্বীকার ও সংগ্রাম করতে হয়েছে।

প্রিয় পাঠক আসুন সেই কাহিনী শুনি তাঁর নিজের-ই মুখে:--- আমার জন্ম জামালপুর জেলার এক অজপাড়াগাঁয়ে । ১৪ কিলোমিটার দূরের শহরে যেতে হতো পায়ে হেঁটে বা সাইকেলে চড়ে । পুরো গ্রামের মধ্যে একমাত্র মেট্রিক পাস ছিলেন আমার চাচা মফিজউদ্দিন ।

আমার বাবা একজন অতি দরিদ্র ভূমিহীন কৃষক। আমরা পাঁচ ভাই, তিন বোন । কোন রকমে খেয়ে না খেয়ে দিন কাটতো আমাদের।
আমার দাদার আর্থিক অবস্থা ছিল মোটামুটি । কিন্তু তিনি আমার বাবাকে তাঁর বাড়িতে ঠাঁই দেননি । দাদার বাড়ি থেকে খানিকটা দূরে একটা ছনের ঘরে আমরা এতগুলো ভাই-বোন আর বাবা-মা থাকতাম । মা তাঁর বাবার বাড়ি থেকে নানার সম্পত্তির সামান্য অংশ পেয়েছিলেন । তাতে তিন বিঘা জমি কেনা হয় ।

চাষাবাদের জন্য অনুপযুক্ত ওই জমিতে বহু কষ্টে বাবা যা ফলাতেন, তাতে বছরে ৫/৬ মাসের খাবার জুটতো । দারিদ্র্য কি জিনিস, তা আমি মর্মে মর্মে উপলব্ধি করেছি-খাবার নেই, পরনের কাপড় নেই, কি এক অবস্থা!!
আমার মা সামান্য লেখাপড়া জানতেন । তাঁর কাছেই আমার পড়াশোনার হাতেখড়ি । তারপর বাড়ির পাশের প্রাথমিক বিদ্যালয়ে ভর্তি হই । কিন্তু আমার পরিবারে এতটাই অভাব যে,আমি যখন তৃতীয় শ্রেণীতে উঠলাম,তখন আর পড়াশোনা চালিয়ে যাওয়ার সুযোগ থাকলো না । বড় ভাই আরো আগে স্কুল ছেড়ে কাজে ঢুকেছেন । আমাকেও লেখাপড়া ছেড়ে রোজগারের পথে নামতে হলো।
আমাদের একটা গাভী আর কয়েকটা খাঁসি ছিল । আমি সকাল থেকে সন্ধা পর্যন্ত ওগুলো মাঠে চড়াতাম।

বিকেল বেলা গাভীর দুধ নিয়ে বাজারে গিয়ে বিক্রি করতাম । এভাবে দুই ভাই মিলে যা আয় করতাম, তাতে কোন রকমে দিন কাটছিল । কিছুদিন চলার পর দুধ বিক্রির আয় থেকে সঞ্চিত আট টাকা দিয়ে আমি পান-বিড়ির দোকান দেই । প্রতিদিন সকাল থেকে সন্ধ্যা পর্যন্ত দোকানে বসতাম । পড়াশোনা তো বন্ধই,আদৌ কি করবো- সেই স্বপ্নও ছিল না।

এক বিকেলে বড় ভাই বললেন, আজ স্কুল মাঠে নাটক হবে । স্পষ্ট মনে আছে, তখন আমার গায়ে দেয়ার মতো কোন জামা নেই । খালি গা আর লুঙ্গি পরে আমি ভাইয়ের সঙ্গে নাটক দেখতে চলেছি । স্কুলে পৌছে আমি তো বিস্ময়ে হতবাক! চারদিকে এত আনন্দময় চমৎকার পরিবেশ । আমার মনে হলো,আমিতো আর সবার মতোই হতে পারতাম । সিদ্ধান্ত নিলাম,আমাকে আবার স্কুলে ফিরে আসতে হবে।
নাটক দেখে বাড়ি ফেরার পথে বড় ভাইকে বললাম,আমি কি আবার স্কুলে ফিরে আসতে পারি না ? আমার বলার ভঙ্গি বা করুণ চাহনি দেখেই হোক কিংবা অন্য কোন কারণেই হোক কথাটা ভাইয়ের মনে ধরলো । তিনি বললেন,ঠিক আছে কাল হেডস্যারের সঙ্গে আলাপ করবো।

পরদিন দুই ভাই আবার স্কুলে গেলাম । বড় ভাই আমাকে হেডস্যারের রুমের বাইরে দাঁড় করিয়ে রেখে ভিতরে গেলেন । আমি বাইরে দাড়িয়ে স্পষ্ট শুনছি, ভাই বললেন আমাকে যেন বার্ষিক পরীক্ষায় অংশগ্রহনের সুযোগটুকু দেওয়া হয় । কিন্তু হেডস্যার অবজ্ঞার ভঙ্গিতে বললেন, সবাইকে দিয়ে কি লেখাপড়া হয়!
স্যারের কথা শুনে আমার মাথা নিচু হয়ে গেল। যতখানি আশা নিয়ে স্কুলে গিয়েছিলাম,স্যারের এক কথাতেই সব ধুলিস্মাৎ হয়ে গেল । তবু বড় ভাই অনেক পীড়াপীড়ি করে আমার পরীক্ষা দেওয়ার অনুমতি যোগার করলেন । পরীক্ষার তখন আর মাত্র তিন মাস বাকি । বাড়ি ফিরে মাকে বললাম, আমাকে তিন মাসের ছুটি দিতে হবে । আমি আর এখানে থাকবো না । কারণ ঘরে খাবার নেই,পরনে কাপড় নেই- আমার কোন বইও নেই, কিন্তু আমাকে পরীক্ষায় পাস করতে হবে।
মা বললেন, কোথায় যাবি? বললাম, আমার এককালের সহপাঠী এবং এখন ক্লাসের ফার্স্ট বয় মোজাম্মেলের বাড়িতে যাবো । ওর মায়ের সঙ্গে আমার পরিচয় আছে । যে ক’দিন কথা বলেছি,তাতে করে খুব ভালো মানুষ বলে মনে হয়েছে । আমার বিশ্বাস, আমাকে উনি ফিরিয়ে দিতে পারবেন না।

দুরু দুরু মনে মোজাম্মেলের বাড়ি গেলাম । সব কিছু খুলে বলতেই খালাম্মা সানন্দে রাজি হলেন । আমার খাবার আর আশ্রয় জুটলো; শুরু হলো নতুন জীবন । নতুন করে পড়াশোনা শুরু করলাম। প্রতিক্ষণেই হেডস্যারের সেই অবজ্ঞাসূচক কথা মনে পড়ে যায় ,জেদ কাজ করে মনে; আরো ভালোকরে পড়াশোনা করি।

যথাসময়ে পরীক্ষা শুরু হলো । আমি এক-একটি পরীক্ষা শেষ করছি আর ক্রমেই যেন উজ্জীবিত হচ্ছি। আমার আত্মবিশ্বাসও বেড়ে যাচ্ছে । ফল প্রকাশের দিন আমি স্কুলে গিয়ে প্রথম সারিতে বসলাম হেডস্যার ফলাফল নিয়ে এলেন । আমি লক্ষ্য করলাম , পড়তে গিয়ে তিনি কেমন যেন দ্বিধান্বিত । আড়চোখে আমার দিকে তাকাচ্ছেন । তারপর ফল ঘোষনা করলেন । আমি প্রথম হয়েছি ! খবর শুনে বড় ভাই আনন্দে কেঁদে ফেললেন । শুধু আমি নির্বিকার-যেন এটাই হওয়ার কথা ছিল।

বাড়ি ফেরার পথে সে এক অভূতপূর্ব দৃশ্য । আমি আর আমার ভাই গর্বিত ভংগিতে হেঁটে আসছি । আর পিছনে এক দল ছেলেমেয়ে আমাকে নিয়ে হৈ চৈ করছে, স্লোগান দিচ্ছে । সারা গাঁয়ে সাড়া পড়ে গেল! আমার নিরক্ষক বাবা, যারঁ কাছে ফার্স্ট আর লাস্ট একই কথা- তিনিও আনন্দে আত্মহারা; শুধু এইটুকু বুঝলেন যে, ছেলে বিশেষ কিছু একটা করেছে।যখন শুনলেন আমি ওপরের ক্লাসে উঠেছি, নতুন বই লাগবে, পরদিনই ঘরের খাসিটা হাটে নিয়ে গিয়ে ১২টাকায় বিক্রি করে দিল। তারপর আমাকে নিয়ে জামালপুর গেলেন। সেখানকার নবনূর লাইব্রেরী থেকে নতুন বই কিনলাম।

আমার জীবনযাত্রা এখন সর্ম্পূন বদলে গেছে। আমি রোজ স্কুলে যাই। অবসরে সংসারের কাজ করি। ইতোমধ্যে স্যারদের সুনজরে পড়ে গেছি। ফয়েজ মৌলবী স্যার আমাকে তারঁ সন্তানের মত দেখাশুনা করতে লাগলেন। সবার আদর,যতœ, øেহে আমি ফার্স্ট হয়েই পঞ্চম শ্রেনীতে উঠলাম।এতদিনে গ্রামের একমাত্র মেট্রিক পাশ মফিজউদ্দিন চাচা আমার খোঁজ নিলেন। তারঁ বাড়ীতে আমার আশ্রয় জুটলো।
প্রাথমিক শিক্ষা শেষ করে আমি দিঘপাইত জুনিয়র হাইস্কুলে ভর্তি হই। চাচা ওই স্কুলের শিক্ষক। অন্য শিক্ষকরাও আমার সংগ্রামের কথা জানতেন। তাই সবার বাড়তি আদর-ভালবাসা পেতাম।

আমি যখন সপ্তম শ্রেনীতে পেরিয়ে অষ্টম শ্রেণীতে উঠবো, তখন চাচা একদিন কোথেকে যেন একটা বিজ্ঞাপন কেটে নিয়ে এসে আমাকে দেখালেন। ওটা ছিল ক্যাডেট কলেজে ভর্তির বিজ্ঞাপন। যথাসময়ে ফরম পূরণ করে পাঠালাম।

এখানে বলা দরকার, আমার নাম ছিল আতাউর রহমান। কিন্তু ক্যাডেট কলেজের ভর্তি ফরমে স্কুলের হেডস্যার আমার নাম আতিউর রহমান লিখে চাচাকে বলেছিলেন, এই ছেলে একদিন অনেক বড় কিছু হবে। দেশে অনেক আতাউর আছে। ওর নামটা একটু আলাদা হওয়া দরকার; তাই আতিউর করে দিলাম।

আমি রাত জেগে পড়াশোনা করে প্রস্তুতি নিলাম। নির্ধারিত দিনে চাচার সঙ্গে পরীক্ষা দিতে রওনা হলাম। ওই আমার জীবনে প্রথম ময়মনসিংহ যাওয়া। গিয়ে সবকিছু দেখে তো চক্ষু চড়কগাছ। এত এত ছেলের মধ্যে আমিই কেবল পায়জামা আর স্পঞ্জ পরে এসেছি। আমার মনে হলো, না আসাটাই ভালো ছিল। অহেতুক কষ্ট করলাম। ভাবলাম হবে না। কিন্তু দুই মাস পর চিঠি পেলাম, আমি নির্বাচিত হয়েছি। এখন চূড়ান্ত পরীক্ষার জন্য ঢাকা ক্যান্টনমেন্টে যেতে হবে।

সবাই খুব খুশি; কেবল আমিই হতাশ। আমার একটা প্যান্ট নেই, যেটা পরে যাবো। শেষে স্কুলের কানাই লাল বিশ্বাসের ফুলপ্যান্টটা ধার করলাম। আর একটা শার্ট যোগাড় হলো। আমি আর চাচা অচেনার ঢাকার উদ্দেশে রওনা হলাম। চাচা শিখিয়ে দিলেন, মৌখিক পরীক্ষা দিতে গিয়ে আমি যেন দরজার কাছে দাড়িঁয়ে বলি: ম্যা আই কাম ইন স্যার? ঠিক মতোই বললাম। তবে এত উচ্চস্বরে বললাম যে, উপস্থিত সবাই হো হো করে হেসে উঠলো।
পরীক্ষকদের একজন মির্জাপুর ক্যাডেট কলেজের এম. ডাব্লিউ. পিট আমাকে আপদমস্তক নিরীক্ষণ করে সবকিছু আচঁ করে ফেললেন। পরম øেহে আমাকে বসালেন। মুহুর্তের মধ্যে তিনি আমার খুব আপন হয়ে গেলেন। আমার মনে হলো, তিনি থাকলে আমার কোন ভয় নেই। পিট স্যার আমার লিখিত পরীক্ষার খাতায় চোখ বুলিয়ে নিলেন। তারপর অন্য পরীক্ষকদের সঙ্গে ইংরেজীতে কী-সব আলাপ করলেন। আমি সবটা না বুঝলেও আচঁ করতে পারলাম যে, আমাকে তাদেঁর পছন্দ হয়েছে। তবে তারাঁ কিছুুই বললেন না। পরদিন ঢাকা শহর ঘুরে দেখে বাড়ি ফিরে এলাম। যথারীতি পড়াশোনায় মনোনিবেশ করলাম। কারন আমি ধরে নিয়েছি আমার চান্স হবে না।

হঠাৎ তিন মাস পর চিঠি এলো। আমি চূড়ান্তভাবে নির্বাচিত হয়েছি। মাসে ১৫০ টাকা বেতন লাগবে। এর মধ্যে ১০০ টাকা দেওয়া হবে, বাকি ৫০ টাকা আমার পরিবারকে যোগান দিতে হবে। চিঠি পড়ে মন ভেঙ্গে গেল। যেখানে আমার পরিবারের তিনবেলা খাওয়ার নিশ্চয়তা নেই, আমি চাচার বাড়িতে মানুষ হচ্ছি, সেখানে প্রতিমাসে ৫০ টাকা বেতন যোগানোর কথা চিন্তাও করা যায় না!

এই যখন অবস্থা, তখন প্রথমবারের মতো আমার দাদা সবর হলেন। এত বছর পর নাতির (আমার) খোঁজ নিলেন। আমাকে অন্য চাচাদের কাছে নিয়ে গিয়ে বললেন, তোমরা থাকতে নাতি আমার এত ভালো সুযোগ পেয়েও পড়তে পারবে না? কিন্তু তাদের অবস্থাও খুব বেশি ভালো ছিল না। তারাঁ বললেন, একবার না হয় ৫০ টাকা যোগাড় করে দেবো, কিন্তু প্রতি মাসে তো সম্ভব নয়। দাদাও বিষয়টা বুঝলেন।
আমি আর কোন আশার আলো দেখতে না পেয়ে সেই ফয়েজ মৌলভী স্যারের কাছে গেলাম। তিনি বললেন, আমি থাকতে কোন চিন্তা করবে না। পরদিন আরো দুইজন সহকর্মী আর আমাকে নিয়ে তিনি হাটে গেলেন। সেখানে গামছা পেতে দোকানে দোকানে ঘু-রলেন। সবাইকে বিস্তারিত বলে সাহায্য চাইলেন। সবাই সাধ্যমতো আট আনা, চার আনা, এক টাকা, দুই টাকা দিলেন। সব মিলিয়ে ১৫০ টাকা হলো। আর চাচারা দিলেন ৫০ টাকা। এই সামান্য টাকা সম্বল করে আমি মির্জাপুর ক্যাডেট কলেজে ভর্তি হলাম। যাতায়াত খরচ বাদ দিয়ে আমি ১৫০ টাকায় তিন মাসের বেতন পরিশোধ করলাম। শুরু হলো অন্য এক জীবন।

প্রথম দিনেই এম. ডাব্লিউ. পিট স্যার আমাকে দেখতে এলেন। আমি সব কিছু খুলে বললাম। আরো জানালাম যে, যেহেতু আমার আর বেতন দেওয়ার সামর্থ্য নেই, তাই তিনমাস পর ক্যাডেট থেকে চলে যেতে হবে। সব শুনে স্যার আমার বিষয়টা বোর্ড মিটিয়ে তুললেন এবং পুরো ১৫০ টাকাই বৃত্তির ব্যবস্থা করে দিলেন। সেই থেকে আমাকে আর পিছনে ফিরে তাকাতে হয়নি।এস.এস.সি পরীক্ষায় ঢাকা বোর্ডে ৫ম স্থান অধিকার করলাম এবং আরো অনেক সাফল্যের মুকুট যোগ হলো।

আমার জীবনটা সাধারণ মানুষের অনুদানে ভরপুর। পরবর্তীকালে আমি আমার এলাকায় স্কুল করেছি, কলেজ করেছি। যখন যাকে যতটা পারি, সাধ্যমত সাহায্য সহযোগিতা করি। কিন্তু সেই যে হাট থেকে তোলা ১৫০ টাকা!! সেই ঋণ আজও শোধ হয়নি। আমার সমগ্র জীবন উৎসর্গ করলেও সেই ঋণ শোধ হবে না। শোধ হবার নয়!!

26 October 2011

Range Constriction for Amibroker AFL

This is a complete trading system which can be applied to a chart, backtested or used as an exploration for buy/sell signals.

It has backtested profitably on all markets I have tested it on.

Basically it looks for stocks that are trading in a reduced range compared to the previous period. For stocks that are trading at recent highs it will buy when the stock moves up within this range, it shorts when the stock moves lower within this range. For exits it either sells into increasing strength or if when the price pulls back (opposite for shorts).

When run as an exploration it will produce a -1 for short, 1 for buy, -99 for sell, 99 for cover and 0 for hold.


PosQty = 1000; // You can define here how many open positions you want
SetOption("MaxOpenPositions", PosQty);
//PositionSize = 1000/PosQty; // invest 100% of portfolio equity divided by Max. position count
SetPositionSize( 1, spsShares );


///////////////////////////////////////////////////////////////////////////////
// Range Constriction
// Finds stocks that are trading in a reduced range compared to previous period.
// Buys when in the reduced range at a recent high price, Shorts when in the reducred range at a recent low price.
// Sells when the stock slows or it makes a sharp move up, Covers when the stock rises or makes a sharp move down


H5 = HHV(H,5); L5 = LLV(L,5);
H10 = HHV(H,10); L10 = LLV(L,10);
H20 = HHV(H,20); L20 = LLV(L,20);
H30 = HHV(H,30); L30 = LLV(L,30);

Range1 = H5-L5 < (Ref(H5,-5)-Ref(L5,-5))*0.5; Range2 = H10-L10 < (Ref(H10,-10)-Ref(L10,-10))*0.5; Range3 = H20-L20 < (Ref(H20,-20)-Ref(L20,-20))*0.5; Range4 = H30-L30 < (Ref(H30,-30)-Ref(L30,-30))*0.5; Consolidation = Ref(Range1,-1) OR Ref(range2,-1) OR Ref(range3,-1) OR Ref(range4,-1) ; Top = C == HHV(C,5); Bottom = C == LLV(C,5); Buy = top AND Consolidation AND C>1 AND C*MA(V,30)>10000000 AND V>1000000 AND C>Ref(C,-1)*1.015
AND C>O AND C>MA(C,50) AND C>LLV(C,200)*2 AND Trix(12)>0;

Sell = CMA(C,10)*1.25 AND NOT Buy OR RSI(2)>95 AND NOT Buy;
InLong = Flip(Buy, Sell);

Short = bottom AND Consolidation AND C>5 AND V>1000000 AND C*MA(V,30)>10000000 AND CMA(C,5) AND NOT Short OR C0, 1,(IIf(Short>0, -1,0))))))),"Buy/Sell",1.0);

08 October 2011

DSE BULL TRAY AND EXIMP

http://jaywalkable.wordpress.com/

http://www.entrepreneur.com/article/41846

http://www.entrepreneur.com/article/220374


http://www.foreign-trade.com/reference/impexp.htm


http://spyglasspoint.com/

07 October 2011

VORTEX

Vortex Indicator w/ Histogram for Amibroker (AFL)


// Vortex Indicator
// S&C Traders Tips Jan 2010
period = Param("Period", 14, 2 );

VMP = Sum( abs( H - Ref( L, -1 ) ), period );
VMM = Sum( abs( L - Ref( H, -1 ) ), period );
STR = Sum( ATR( 1 ), period );

VIP = VMP / STR;
VIM = VMM / STR;

//Plot( VIP, "VI"+period+"+", colorBlue);
//Plot( VIM, "VI"+period+"-", colorRed );


Hist = VIP - VIM;
HistPrev = Ref(Hist,-1);

Color = IIf(Hist>HistPrev,colorCustom9,
IIf(hist0,colorCustom11,
IIf(hist<0,colorCustom8,colorWhite)); Plot( Hist, "", color, styleHistogram+styleOwnScale+styleThick ); Vortex Indicator System for Amibroker (AFL) // Vortex Indicator // S&C Traders Tips Jan 2010 period = Param("Period" , 14, 2 ); VMP = Sum( abs( H - Ref( L, -1 ) ), period ); VMM = Sum( abs( L - Ref( H, -1 ) ), period ); STR = Sum( ATR( 1 ), period ); VIP = VMP / STR; VIM = VMM / STR; Plot( VIP, "VI"+period+ "+", colorBlue); Plot( VIM, "VI"+period+ "-", colorRed ); //The system is defined as: //- Go long when the VI (or Dmi) goes from less than zero to greater than //zero. //- Go short when the VI (or Dmi) goes from above zero to less than zero. // - All trades are placed "next day market on open." // That would translate to: SetTradeDelays( 1,1,1,1); // everything delayed 1 day Buy = VIP > 0 AND Ref(VIP,-1) < 0; BuyPrice = Open; Sell = VIP < 0 and Ref(VIP,-1) > 0;
SellPrice = Open;
Short = Sell;
Cover = Buy;


VORTEX OSCILI


_SECTION_BEGIN("Vortex Oscillator");

// Vortex Indicator
// S&C Traders Tips Jan 2010
SetChartBkColor(colorBlack);
SetBarsRequired(sbrAll);
period = Param("Period", 21, 2 );
VMP = Sum( abs( H - Ref( L, -1 ) ), period );
VMM = Sum( abs( L - Ref( H, -1 ) ), period );
STR = Sum( ATR( 10 ), period );

VIP = VMP / STR;
VIM = VMM / STR;
K1=VIP-VIM;
K=TEMA(K1,7);
ifish=EMA(EMA(EMA(EMA(K,3),3),3),3);
Color=IIf(ifish>0,IIf(ifish>Ref(ifish,-1),colorGreen,colorYellow),IIf(ifish>Ref(ifish,-1),colorBlue,colorRed));
Plot(ifish," Vortex Oscillator ",Color,styleHistogram | styleThick, maskHistogram);
Plot(0,"",colorYellow,styleDashed);


_SECTION_END();

04 October 2011

AFL CODE SITE

http://www.aussiestockforums.com/forums/index.php

http://www.imageview.us/amibroker/


http://www.traders.com/index.php/sac-magazine/departments/traders-tips/182-amibroker-spearman-indicator--valcu-article-code

02 October 2011

Trend Quality Indicators for Amibroker (AFL)

Trend Quality Indicators for Amibroker (AFL)


Originally described in Stocks & Commodities April 2004, by David Sepiashvili.
The trend-quality indicator (or Q-indicator) is a trend detection and estimation tool that is based on a two-step filtering technique. It measures cumulative price changes over term-oriented semicycles and relates them to ‘noise.’ The approach reveals congestion and trending periods of the price movement and focuses on the most important trends, evaluating their strength in the process. The indicator is presented in a centered oscillator and banded oscillator format.

Both Q-Indicator (the Trend Quality one) and the B-Indicator (trend-noise Balance Indicator) can be displayed (alternatively).

Different crossover signals can be easily added by just adding the required string in ParamList (the string SHALL follows the convention ?MA m1,m2 where ?MA is the MA type (EMA, SMA or WMA) and m1,m2 are the period ALWAYS in 2 digits (i.e. 5 shall be written as 05)

Q-indicator has 3 levels: 2(+/-) and 5(+/-): 0 to 2 means weak or NO trend; 2 to 5 means moderate trend, >= 5 means strong trend (Up trend if positive, Down trend if negative).

B-Indicator fluctuates between 0 to 100. It is better suited to identifies overbought/oversold levels. It has 2 levels: 65 and 80. 0 to 65 means NO or weak trend, 65 to 80 means moderate trend and >= 80 means strong trend.

I like this indicator since it is quite “agnostic” about the chosen parameters (Obviously the crossover MAs do matter !!).

Here is a screenshot of how the indicator looks:


Trend Quality Indicators for Amibroker (AFL)

In "Trend-Quality Indicator" in this issue, David Sepiashvili presents an innovative trend-detection tool -- the trend-quality indicator -- that attempts to estimate the trend in relation to noise.

Calculations presented in the article can be easily reproduced using AmiBroker Formula Language. The only tricky part is a piecewise exponential moving average that restarts the calculations on every moving average crossover, but we managed to implement it in two lines of code, thanks to AmiBroker's powerful Ama2 function, which allows easy implementation of all kinds of single-order infinite impulse response filters.

Listing 1 shows ready-to-use indicator code to plot the Q-indicator. In AmiBroker, select Indicator Builder from the Analysis menu, click the "Add" button, enter the formula, and then press "Apply." Figure 3 shows a sample chart.


// Piecewise EMA is an EMA that restarts calculations each time
// the 'sincebar' argument is true
function PiecewiseEMA( array, range, sincebar )
{
factor = IIf( sincebar, 1, 2/(range+1) );
return AMA2( array, factor, 1-factor );
}
// parameters
m=4;
n=250;
// generate reversal signals based on EMA crossover rule
Lpf1 = EMA( C, 7 );
Lpf2 = EMA( C, 15 );
CrossPoint = Cross( Lpf1, Lpf2 ) OR Cross( Lpf2, Lpf1 );
Periods = BarsSince( CrossPoint );
// variable bar sum
DC = Close - Ref( Close, -1 );
CPC = Sum( DC, Periods );
// smooth CPC by piecewise 4 bar EMA
Trend = PiecewiseEMA( CPC, 4, CrossPoint );
// noise
DT = CPC - Trend;
Noise = 2 * sqrt( MA( DT^2, n ) );
// alternative 'linear' noise calculation
// Noise = 2 * MA( abs( DT ), n ) );
QIndicator = Trend/Noise;
Plot(sign(Lpf1-Lpf2), "Rev", colorRed );
Plot( Qindicator, "Qindicator", colorGreen, styleHistogram);
PlotGrid( -1 );
PlotGrid( 1 );
PlotGrid( 2 );
PlotGrid( -2 );
PlotGrid( 5 );
PlotGrid( 5);

Trend Quality Indicators for Amibroker (AFL)

Trend Quality Indicators for Amibroker (AFL)


Originally described in Stocks & Commodities April 2004, by David Sepiashvili.
The trend-quality indicator (or Q-indicator) is a trend detection and estimation tool that is based on a two-step filtering technique. It measures cumulative price changes over term-oriented semicycles and relates them to ‘noise.’ The approach reveals congestion and trending periods of the price movement and focuses on the most important trends, evaluating their strength in the process. The indicator is presented in a centered oscillator and banded oscillator format.

Both Q-Indicator (the Trend Quality one) and the B-Indicator (trend-noise Balance Indicator) can be displayed (alternatively).

Different crossover signals can be easily added by just adding the required string in ParamList (the string SHALL follows the convention ?MA m1,m2 where ?MA is the MA type (EMA, SMA or WMA) and m1,m2 are the period ALWAYS in 2 digits (i.e. 5 shall be written as 05)

Q-indicator has 3 levels: 2(+/-) and 5(+/-): 0 to 2 means weak or NO trend; 2 to 5 means moderate trend, >= 5 means strong trend (Up trend if positive, Down trend if negative).

B-Indicator fluctuates between 0 to 100. It is better suited to identifies overbought/oversold levels. It has 2 levels: 65 and 80. 0 to 65 means NO or weak trend, 65 to 80 means moderate trend and >= 80 means strong trend.

I like this indicator since it is quite “agnostic” about the chosen parameters (Obviously the crossover MAs do matter !!).

Here is a screenshot of how the indicator looks:


Trend Quality Indicators for Amibroker (AFL)

In "Trend-Quality Indicator" in this issue, David Sepiashvili presents an innovative trend-detection tool -- the trend-quality indicator -- that attempts to estimate the trend in relation to noise.

Calculations presented in the article can be easily reproduced using AmiBroker Formula Language. The only tricky part is a piecewise exponential moving average that restarts the calculations on every moving average crossover, but we managed to implement it in two lines of code, thanks to AmiBroker's powerful Ama2 function, which allows easy implementation of all kinds of single-order infinite impulse response filters.

Listing 1 shows ready-to-use indicator code to plot the Q-indicator. In AmiBroker, select Indicator Builder from the Analysis menu, click the "Add" button, enter the formula, and then press "Apply." Figure 3 shows a sample chart.


// Piecewise EMA is an EMA that restarts calculations each time
// the 'sincebar' argument is true
function PiecewiseEMA( array, range, sincebar )
{
factor = IIf( sincebar, 1, 2/(range+1) );
return AMA2( array, factor, 1-factor );
}
// parameters
m=4;
n=250;
// generate reversal signals based on EMA crossover rule
Lpf1 = EMA( C, 7 );
Lpf2 = EMA( C, 15 );
CrossPoint = Cross( Lpf1, Lpf2 ) OR Cross( Lpf2, Lpf1 );
Periods = BarsSince( CrossPoint );
// variable bar sum
DC = Close - Ref( Close, -1 );
CPC = Sum( DC, Periods );
// smooth CPC by piecewise 4 bar EMA
Trend = PiecewiseEMA( CPC, 4, CrossPoint );
// noise
DT = CPC - Trend;
Noise = 2 * sqrt( MA( DT^2, n ) );
// alternative 'linear' noise calculation
// Noise = 2 * MA( abs( DT ), n ) );
QIndicator = Trend/Noise;
Plot(sign(Lpf1-Lpf2), "Rev", colorRed );
Plot( Qindicator, "Qindicator", colorGreen, styleHistogram);
PlotGrid( -1 );
PlotGrid( 1 );
PlotGrid( 2 );
PlotGrid( -2 );
PlotGrid( 5 );
PlotGrid( 5);

16 September 2011

Against all odds. Written by Thierry HUITEL. Based on Jim Varney’s work—
CANDLESTOCHASTICS— , and all the amibroker group :-).This Exploration is a
scan for 24 different buy or sell signals that selects days when several
bullish or bearish indicators are triggered at the same time.

Against all odds (draft). Written by Thierry HUITEL o-l—-}
based on Jim Varney’s work— CANDLESTOCHASTICS—
and all the amibroker group :-)

This Exploration is a scan for 24 different buy or sell signals.
The odds are 1 of 6 to get a TWO with a dice. If you try 1000 times, the odds are more than 99%.
The aim of the exploration is to find days when many bullish or bearish signs are triggered at the same time. If 5 indicators give a buy advice, it is more reliable than one.
I invite everybody to add your own systems to these ones, to improve the reliability. And experimented technical analysts could give advices to avoid the trap of using several different indicators all working off the same input data.

Vol Index: this column is the ratio of today’s volume to the 14-day average volume.
This column should be sorted Descending. The best signals are occur when VolIndex is at least 2 or higher.

PCL[up]: Piercing Line, “up” signifies Bullish.
MDS[up]: Morning Doji Star
BLE[up]: Bullish Engulfing
HAM[up]: Hammer
BRE[dn]: Bearish Engulfing, “dn” signifies Bearish.
DCC[dn]: Dark Cloud Cover
EDS[dn]: Evening Doji Star
TDREI[up] & [dn]: Tom DeMark’s Range Expansion Index
KUP[up] & [dn]: Keltner Bands -DIMITRIS TSOKAKIS
RSI[up] & [dn]: Relative Strength Index 14 periods
MFI[up] & [dn]: Money Flow Index
ST2[up] & [dn]: Stochastic Slow – Donald Dalley
DIV[up] & [dn]: % R divergence -DIMITRIS TSOKAKIS
KST[up] & [dn]: MARTIN PRING’S KST MOMENTUM SYSTEM -TJ
COP[up]: Coppock Curve TJ
SMH[up] & [dn]: smash day pattern. DIMA
CHK[up] & [dn]: Chaikin Money Flow. Thierry Huitel

A “1” in the column signifies TRUE, a “0” indicates no signal.

10 September 2011

SVE Inverse Fisher RSI for Amibroker (AFL)

An excellent indicator for short term signals. Buy when RSI crosses above 50 and sell below 50. Simple…….. Be careful higher values are not overbought and lower values are not oversold.


AFL


_SECTION_BEGIN("SVE Inv Fisher RSI");

RSIPer = Param("RSI Period", 4, 2, 30 );
EMAper = Param("EMA Period", 4, 1, 100 );

mwiter = C;
RainbW = 0;
for( i = 0; i < 10; i++ ) { weight = Max( 5 - i, 1 ); mwiter = WMA( mwiter, 2 ); RainbW += weight * mwiter; } RainbW /= 20; x = 0.1 * ( RSIa( RainbW, RSIper ) - 50 ); EMA1 = EMA( x, EMAPer ); EMA2 = EMA( EMA1, EMAPer ); Difference = EMA1 - EMA2; Z1Ema = EMA1 + Difference; ex = exp( 2 * Z1EMA ); y = ( ex - 1 )/( ex + 1 ); invfish = 50 * ( y + 1 ); Plot( invfish, "SVE Inverse Fisher RSI", colorBlue ); PlotOHLC( invfish,invfish,50,invfish, "", IIf(invfish > 50, colorGreen,colorRed ),
styleNoLabel | styleCloud | styleClipMinMax, 12, 88 );
_SECTION_END();

08 September 2011

Cannot open local drive C and D directly

When I try to open my local drive C: it will not open directly, a dialog box will appear and you will select what program you need to use to open the drive? what could be the problem? please help.


SOLUTIONS

I was lucky enuff to have this answer!!!!!
go to run

Type " regedit"

then find " ctrl+f"

in this box write "mountpoints2" and delete it ......

then again press "ctrl+f" again to find all mountpoints2 until ALL of these files are deleted
"there are a few of them!"

Prob solved!

My Blog List

Total Pageviews

Search This Blog

Followers